Philips 2014 Annual Report Download - page 34
Download and view the complete annual report
Please find page 34 of the 2014 Philips annual report below. You can navigate through the pages in the report by either clicking on the pages listed below, or by using the keyword search tool below to find specific information within the annual report.-
 1
1 -
2
-
3
-
4
-
5
-
6
-
7
-
8
-
9
-
10
-
11
-
12
-
13
-
14
-
15
-
16
-
17
-
18
-
19
-
20
-
21
-
22
-
23
-
 24
24 -
 25
25 -
 26
26 -
 27
27 -
 28
28 -
 29
29 -
 30
30 -
 31
31 -
 32
32 -
 33
33 -
 34
34 -
 35
35 -
 36
36 -
 37
37 -
 38
38 -
 39
39 -
 40
40 -
 41
41 -
 42
42 -
 43
43 -
 44
44 -
45
-
46
-
47
-
48
-
49
-
50
-
51
-
52
-
53
-
54
-
55
-
56
-
57
-
58
-
59
-
60
-
61
-
62
-
63
-
64
-
65
-
66
-
67
-
68
-
69
-
70
-
71
-
72
-
73
-
74
-
75
-
76
-
77
-
78
-
79
-
80
-
81
-
82
-
83
-
84
-
85
-
86
-
87
-
88
-
89
-
90
-
91
-
92
-
93
-
94
-
95
-
96
-
97
-
98
-
99
-
100
-
101
-
102
-
103
-
104
-
105
-
106
-
107
-
108
-
109
-
110
-
111
-
112
-
113
-
114
-
115
-
116
-
117
-
118
-
119
-
120
-
121
-
122
-
123
-
124
-
125
-
126
-
127
-
128
-
129
-
130
-
131
-
132
-
133
-
134
-
135
-
136
-
137
-
138
-
139
-
140
-
141
-
142
-
143
-
144
-
145
-
146
-
147
-
148
-
149
-
150
-
151
-
152
-
153
-
154
-
155
-
156
-
157
-
158
-
159
-
160
-
161
-
162
-
163
-
164
-
165
-
166
-
167
-
168
-
169
-
170
-
171
-
172
-
173
-
174
-
175
-
176
-
177
-
178
-
179
-
180
-
181
-
182
-
183
-
184
-
185
-
186
-
187
-
188
-
189
-
190
-
191
-
192
-
193
-
194
-
195
-
196
-
197
-
198
-
199
-
200
-
201
-
202
-
203
-
204
-
205
-
206
-
207
-
208
-
209
-
210
-
211
-
212
-
213
-
214
-
215
-
216
-
217
-
218
-
219
-
220
-
221
-
222
-
223
-
224
-
225
-
226
-
227
-
228
-
229
-
230
-
231
-
232
-
233
-
234
-
235
-
236
-
237
-
238
-
239
-
240
-
241
-
242
-
243
-
244
 |
 |

Group performance 5.2.3
34 Annual Report 2014
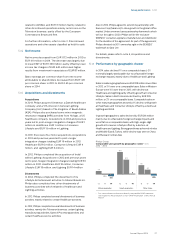
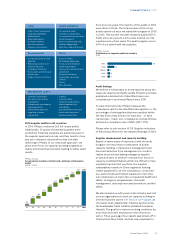
Philips Group
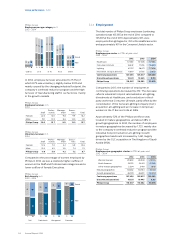
Employees per age category in %
2012 - 2014
4
7
‘12
4
6
‘13
4
7
‘14
under 25
28
33
‘12
27
32
‘13
26
31
‘14
25-35
31
31
‘12
31
32
‘13
31
32
‘14
35-45
24
20
‘12
25
21
‘13
25
21
‘14
45-55
13
9
‘12
13
9
‘13
14 Male
9Female
‘14
over 55
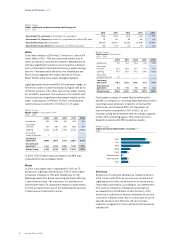
In 2014, employee turnover amounted to 15.7% (of
which 8.7% was voluntary), slightly below 2013 and
mainly caused by the changing industrial footprint, the
company’s overhead reduction program and the high
turnover of manufacturing sta in our factories, mainly
in the growth markets.
Philips Group
Employee turnover in %
2014
Sta
Profes-
sionals
Manage-
ment
Execu-
tives Total
Female 22.4 12.0 9.8 9.9 18.2
Male 19.1 10.2 8.8 14.0 14.1
Philips Group 20.5 10.7 9.0 13.3 15.7
Philips Group
Voluntary turnover in %
2014
Sta
Profes-
sionals
Manage-
ment
Execu-
tives Total
Female 13.5 7.0 5.2 5.9 10.8
Male 10.3 5.5 3.9 7.4 7.5
Philips Group 11.6 5.9 4.2 7.2 8.7
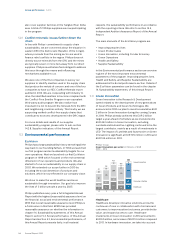
Compared to the percentage of women employed by
Philips in 2014, we see a relatively higher outow of
women in the Sta and Professionals categories and a
lower outow of female Executives.
Philips Group
Exit diversity in %
2013 - 2014
57
43
‘13
54
46
‘14
Staff
70
30
‘13
67
33
‘14
Professionals
82
18
‘13
78
22
‘14
Management
91
9
‘13
87 Male
13 Female
‘14
Executives
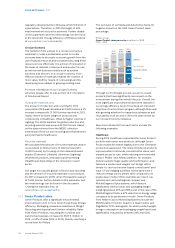
5.2.4 Employment
The total number of Philips Group employees (continuing
operations) was 105,365 at the end of 2014, compared to
105,637 at the end of 2013. Approximately 36% were
employed in the Lighting sector, 35% in the Healthcare sector
and approximately 16% in the Consumer Lifestyle sector.
Philips Group
Employees per sector in FTEs at year-end
2012 - 2014
2012 2013 2014
Healthcare 37,460 37,008 37,065
Consumer Lifestyle 16,542 17,255 16,639
Lighting 41,757 38,671 37,808
Innovation, Group & Services 11,697 12,703 13,853
Continuing operations 107,456 105,637 105,365
Discontinued operations 10,631 10,445 8,313
Philips Group 118,087 116,082 113,678
Compared to 2013, the number of employees in
continuing operations decreased by 272. The decrease
reects industrial footprint rationalization at Lighting,
divestments at Healthcare, and a reduction in third-
party workers at Consumer Lifestyle, partly oset by the
consolidation of the General Lighting Company (GLC)
acquisition at Lighting and an increase in temporary
workers in the IT Service Units at IG&S.
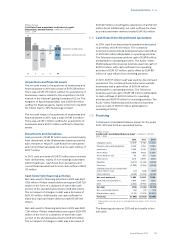
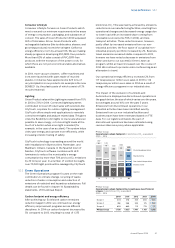
Approximately 52% of the Philips workforce was
located in mature geographies, and about 48% in
growth geographies. In 2014, the number of employees
in mature geographies decreased by 1,733, mainly due
to the company’s overhead reduction program and the
industrial footprint reduction at Lighting. Growth
geographies headcount increased by 1,461, largely
driven by the GLC acquisition in The Kingdom of Saudi
Arabia (KSA).
Philips Group
Employees per geographic cluster in FTEs at year-end
2012 - 2014
2012 2013 2014
Western Europe 29,803 28,944 29,105
North America 25,375 24,401 22,283
Other mature geographies 3,304 3,419 3,643
Mature geographies 58,482 56,764 55,031
Growth geographies 48,974 48,873 50,334
Continuing operations 107,456 105,637 105,365
Discontinued operations 10,631 10,445 8,313
Philips Group 118,087 116,082 113,678