Philips 2014 Annual Report Download - page 85
Download and view the complete annual report
Please find page 85 of the 2014 Philips annual report below. You can navigate through the pages in the report by either clicking on the pages listed below, or by using the keyword search tool below to find specific information within the annual report.-
 1
1 -
2
-
3
-
4
-
5
-
6
-
7
-
8
-
9
-
10
-
11
-
12
-
13
-
14
-
15
-
16
-
17
-
18
-
19
-
20
-
21
-
22
-
23
-
24
-
25
-
26
-
27
-
28
-
29
-
30
-
31
-
32
-
33
-
34
-
35
-
36
-
37
-
38
-
39
-
40
-
41
-
42
-
43
-
44
-
45
-
46
-
47
-
48
-
49
-
50
-
51
-
52
-
53
-
54
-
55
-
56
-
57
-
58
-
59
-
60
-
61
-
62
-
63
-
64
-
65
-
66
-
67
-
68
-
69
-
70
-
71
-
72
-
73
-
74
-
 75
75 -
 76
76 -
 77
77 -
 78
78 -
 79
79 -
 80
80 -
 81
81 -
 82
82 -
 83
83 -
 84
84 -
 85
85 -
 86
86 -
 87
87 -
 88
88 -
 89
89 -
 90
90 -
 91
91 -
 92
92 -
 93
93 -
 94
94 -
 95
95 -
96
-
97
-
98
-
99
-
100
-
101
-
102
-
103
-
104
-
105
-
106
-
107
-
108
-
109
-
110
-
111
-
112
-
113
-
114
-
115
-
116
-
117
-
118
-
119
-
120
-
121
-
122
-
123
-
124
-
125
-
126
-
127
-
128
-
129
-
130
-
131
-
132
-
133
-
134
-
135
-
136
-
137
-
138
-
139
-
140
-
141
-
142
-
143
-
144
-
145
-
146
-
147
-
148
-
149
-
150
-
151
-
152
-
153
-
154
-
155
-
156
-
157
-
158
-
159
-
160
-
161
-
162
-
163
-
164
-
165
-
166
-
167
-
168
-
169
-
170
-
171
-
172
-
173
-
174
-
175
-
176
-
177
-
178
-
179
-
180
-
181
-
182
-
183
-
184
-
185
-
186
-
187
-
188
-
189
-
190
-
191
-
192
-
193
-
194
-
195
-
196
-
197
-
198
-
199
-
200
-
201
-
202
-
203
-
204
-
205
-
206
-
207
-
208
-
209
-
210
-
211
-
212
-
213
-
214
-
215
-
216
-
217
-
218
-
219
-
220
-
221
-
222
-
223
-
224
-
225
-
226
-
227
-
228
-
229
-
230
-
231
-
232
-
233
-
234
-
235
-
236
-
237
-
238
-
239
-
240
-
241
-
242
-
243
-
244
 |
 |

Supervisory Board report 10.2.4
Annual Report 2014 85
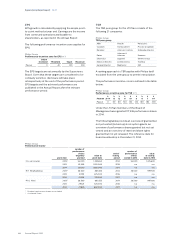
10.2.4 Remuneration costs
The table below gives an overview of the costs incurred
by the Company in the nancial year in relation to the
remuneration of the Board of Management. Costs
related to performance shares, stock option and
restricted share right grants are taken by the Company
over a number of years. As a consequence, the costs
mentioned below in the performance shares, stock
options and restricted share rights columns are the
accounting cost of multi-year grants given to members
of the Board of Management during their board
membership.
Philips Group
Remuneration Board of Management1) in EUR
2014
Costs in the year
annual
base
salary2)
base
salary
realized
annual
incentive
perfor-
mance
shares
stock
options
restricted
share
rights
pension
costs
other
compen-
sation
F.A. van Houten 1,150,000 1,137,500 349,600 860,564 101,344 76,951 485,655 86,554
R.H. Wirahadiraksa 725,000 712,500 156,600 446,337 68,914 52,965 298,995 35,909
P.A.J. Nota 650,000 643,750 258,180 406,358 68,914 57,200 267,037 63,507
2,493,750 764,380 1,713,259 239,172 187,116 1,051,687 185,970
1) Reference date for board membership is December 31, 2014
2) Salary as of April 1, 2014
10.2.5 Base salary
The base salaries of the members of the Board of
Management have been reviewed in April 2014 as part
of the regular remuneration review. The salary of Frans
van Houten has been increased per April 1, 2014, from
EUR 1,100,000 to EUR 1,150,000. The salary of the CFO,
Ron Wirahadiraksa, has been increased from EUR
675,000 to EUR 725,000. The salary of Pieter Nota has
been increased from EUR 625,000 to EUR 650,000. All
increases were made to move base salary levels closer
to market levels.
10.2.6 Annual Incentive
Each year, a variable cash incentive (Annual Incentive)
can be earned, based on the achievement of specic
and challenging targets. The Annual Incentive criteria
are made up for 80% of the nancial indicators of the
Company and for 20% of the team targets comprising,
among others, sustainability targets as part of our
EcoVision program.
The on-target Annual Incentive percentage is set at
80% of the base salary for the CEO and at 60% of the
base salary for other members of the Board of
Management. The maximum Annual Incentive
achievable is 160% of the annual base salary for the
CEO and 120% of the annual base salary for members
of the Board of Management.
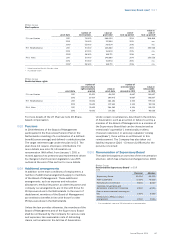
To support the performance culture, the Annual
Incentive plan is based on (nancial) targets at ‘own
level’ and ‘group’ level results (line-of-sight). The 2014
payouts, shown in the table below, reect the below
target performance of EBITA, CSG and ROIC at the
Group level. In addition, the average Team Target
payout was also less than the target level.
Philips Group
Annual Incentive realization in EUR
2014 (payout in 2015)
realized annual
incentive
as a % of base
salary (2014)
F.A. van Houten 349,600 30.4%
R.H. Wirahadiraksa 156,600 21.6%
P.A.J. Nota 258,180 39.7%
10.2.7 Long-Term Incentive Plan
Grants made under the 2014 LTI Plan consist of
performance shares only.
Grant size
The annual grant size is set by reference to a multiple
of base salary. For the CEO the annual grant size is set
at 120% of base salary and for the other members of the
Board of Management at 100% of base salary. This is
broadly at a mid-market level against leading European
listed companies. The actual number of performance
shares to be awarded is determined by reference to the
average of the closing price of the Philips share on the
day of publication of the quarterly results and the four
subsequent dealing days.
Vesting schedule
Dependent upon the achievement of the performance
conditions, cli-vesting applies three years after the
date of grant. During the vesting period, the value of
dividends will be added to the performance shares in
the form of shares. These dividend-equivalent shares
will only be delivered to the extent that the award
actually vests.
Performance conditions
Vesting of the performance shares is based on two
equally weighted performance conditions:
▪50% Adjusted Earnings per Share growth (“EPS”) and
▪50% Relative Total Shareholder Return (“TSR”)