Philips 2014 Annual Report Download - page 22
Download and view the complete annual report
Please find page 22 of the 2014 Philips annual report below. You can navigate through the pages in the report by either clicking on the pages listed below, or by using the keyword search tool below to find specific information within the annual report.-
 1
1 -
2
-
3
-
4
-
5
-
6
-
7
-
8
-
9
-
10
-
11
-
 12
12 -
 13
13 -
 14
14 -
 15
15 -
 16
16 -
 17
17 -
 18
18 -
 19
19 -
 20
20 -
 21
21 -
 22
22 -
 23
23 -
 24
24 -
 25
25 -
 26
26 -
 27
27 -
 28
28 -
 29
29 -
 30
30 -
 31
31 -
 32
32 -
33
-
34
-
35
-
36
-
37
-
38
-
39
-
40
-
41
-
42
-
43
-
44
-
45
-
46
-
47
-
48
-
49
-
50
-
51
-
52
-
53
-
54
-
55
-
56
-
57
-
58
-
59
-
60
-
61
-
62
-
63
-
64
-
65
-
66
-
67
-
68
-
69
-
70
-
71
-
72
-
73
-
74
-
75
-
76
-
77
-
78
-
79
-
80
-
81
-
82
-
83
-
84
-
85
-
86
-
87
-
88
-
89
-
90
-
91
-
92
-
93
-
94
-
95
-
96
-
97
-
98
-
99
-
100
-
101
-
102
-
103
-
104
-
105
-
106
-
107
-
108
-
109
-
110
-
111
-
112
-
113
-
114
-
115
-
116
-
117
-
118
-
119
-
120
-
121
-
122
-
123
-
124
-
125
-
126
-
127
-
128
-
129
-
130
-
131
-
132
-
133
-
134
-
135
-
136
-
137
-
138
-
139
-
140
-
141
-
142
-
143
-
144
-
145
-
146
-
147
-
148
-
149
-
150
-
151
-
152
-
153
-
154
-
155
-
156
-
157
-
158
-
159
-
160
-
161
-
162
-
163
-
164
-
165
-
166
-
167
-
168
-
169
-
170
-
171
-
172
-
173
-
174
-
175
-
176
-
177
-
178
-
179
-
180
-
181
-
182
-
183
-
184
-
185
-
186
-
187
-
188
-
189
-
190
-
191
-
192
-
193
-
194
-
195
-
196
-
197
-
198
-
199
-
200
-
201
-
202
-
203
-
204
-
205
-
206
-
207
-
208
-
209
-
210
-
211
-
212
-
213
-
214
-
215
-
216
-
217
-
218
-
219
-
220
-
221
-
222
-
223
-
224
-
225
-
226
-
227
-
228
-
229
-
230
-
231
-
232
-
233
-
234
-
235
-
236
-
237
-
238
-
239
-
240
-
241
-
242
-
243
-
244
 |
 |
Group performance 5.1
22 Annual Report 2014
due to Healthcare and Lighting. Healthcare comparable
sales declined by 2%, mainly due to Imaging Systems.
Lighting comparable sales were 3% below the level of
2013, as declines at Light Sources & Electronics and
Consumer Luminaires were tempered by growth at
Professional Lighting Solutions. Comparable sales at
Consumer Lifestyle were 6% above the level of 2013,
mainly driven by double-digit growth at Health & Wellness.
•
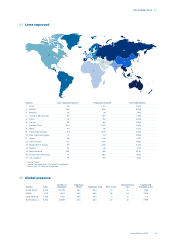
Comparable sales in growth geographies were in line with
2013, while mature geographies declined by 1% as a result
of the overall macroeconomic developments. In 2014,
growth geographies accounted for 35% of total sales.
•
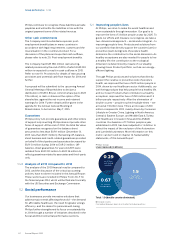
EBIT amounted to EUR 486 million, or 2.3% of sales,
compared to EUR 1,855 million, or 8.4% of sales, in 2013.
EBIT declines at Healthcare, Lighting and IG&S were partly
offset by an improvement at Consumer Lifestyle.
•
Operating activities generated cash flows of EUR 1,303
million, which was EUR 391 million higher than in 2013. The
increase was mainly due to higher cash inflows and
working capital reductions in 2014, as well as the payment
of the European Commission fine in 2013. Cash flows
before financing activities were EUR 269 million higher
than in 2013, as an increase in cash flows from operating
activities was partly offset by higher outflows related to
acquisitions of new businesses.
•
By the end of 2014, Philips had completed 41% of the EUR
1.5 billion share buy-back program.
Philips Group
Key data in millions of EUR unless otherwise stated
2012 - 2014
2012 2013 2014
Condensed statement of income
Sales 22,234 21,990 21,391
EBITA 1) 1,003 2,276 821
as a % of sales 4.5% 10.4% 3.8%
EBIT 592 1,855 486
as a % of sales 2.7% 8.4% 2.3%
Financial income and expenses (329) (330) (301)
Income tax expense (218) (466) (26)
Results of investments in
associates (211) (25) 62
Income (loss) from continuing
operations (166) 1,034 221
Income from discontinued
operations - net of income tax 136 138 190
Net income (loss) (30) 1,172 411
Other indicators
Net income (loss) attributable to
shareholders per common share
in EUR:
basic (0.04) 1.28 0.45
diluted (0.04) 1.27 0.45
Net operating capital (NOC)1) 9,316 10,238 8,838
Cash ows before nancing
activities1) 1,174 50 319
Employees (FTEs) 118,087 116,082 113,678
of which discontinued
operations 10,631 10,445 8,313
1) For a reconciliation to the most directly comparable GAAP measures,
see chapter 15, Reconciliation of non-GAAP information, of this Annual
Report
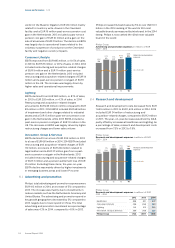
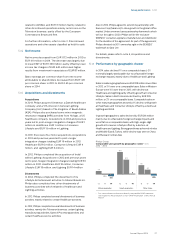
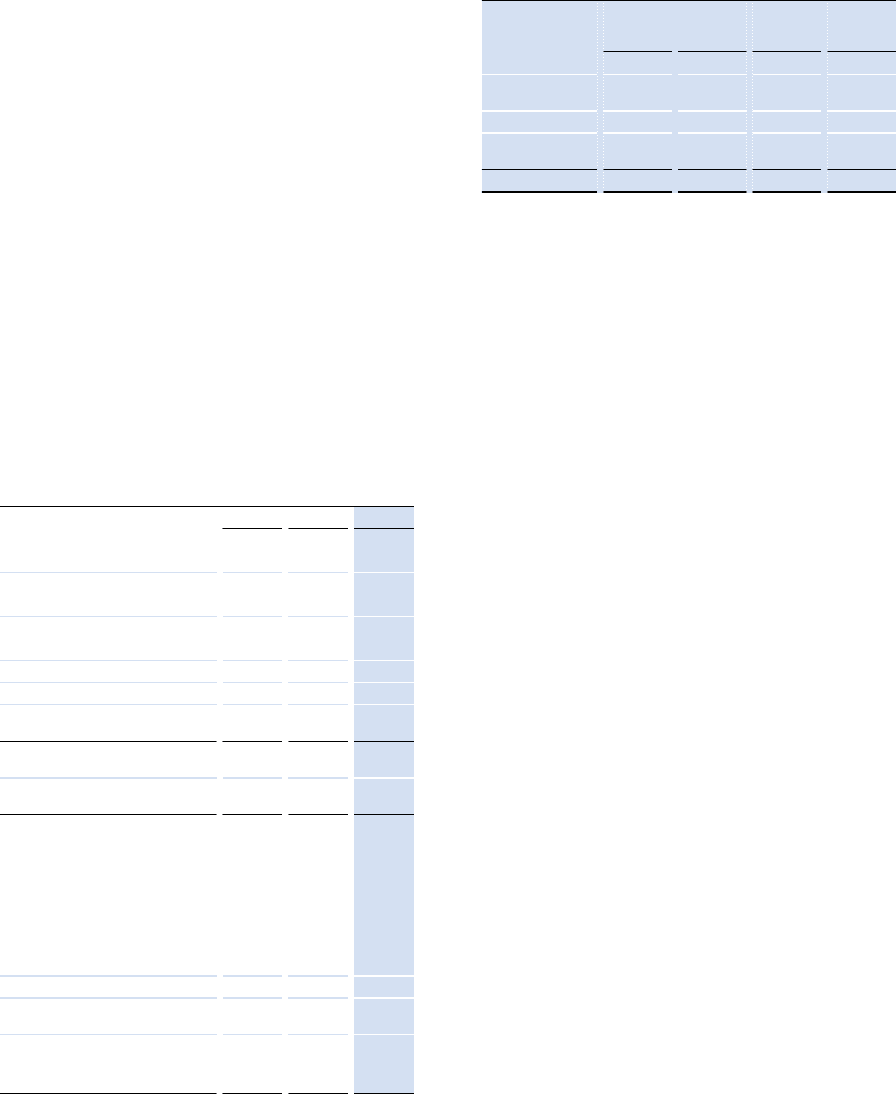
5.1.1 Sales
The composition of sales growth in percentage terms in
2014, compared to 2013, is presented in the table below.
Philips Group
Sales growth composition in %
2014 versus 2013
com-
parable
growth
currency
eects
consoli-
dation
changes
nominal
growth
Healthcare (2.0) (1.6) (0.5) (4.1)
Consumer
Lifestyle 5.8 (3.1) 0.0 2.7
Lighting (2.6) (2.3) 1.0 (3.9)
Innovation, Group
& Services (11.8) (0.1) 2.9 (9.0)
Philips Group (0.9) (2.0) 0.2 (2.7)
Group sales amounted to EUR 21,391 million in 2014,
which represents a 3% nominal decline compared to
2013.
Adjusted for a 2% negative currency eect, comparable
sales were 1% below the level of 2013. Comparable sales
were up 6% at Consumer Lifestyle. Healthcare and
Lighting saw comparable sales decline by 2% and 3%
respectively.
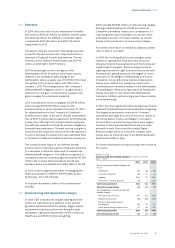
Healthcare sales amounted to EUR 9,186 million, which
was EUR 389 million lower than in 2013. Mid-single-
digit growth at Customer Services and low-single-digit
growth at Patient Care & Monitoring Solutions were
oset by a double-digit decline at Imaging Systems.
Healthcare Informatics, Solutions & Services sales were
in line with 2013. Mature geographies recorded a low-
single-digit decline, mainly due to North America and
Western Europe. Growth geographies also recorded a
low-single-digit decline, with solid growth in Latin
America and Middle East & Turkey oset by a double-
digit decline in China.
Consumer Lifestyle reported sales of EUR 4,731 million,
which was EUR 126 million higher than in 2013, or 6%
higher on a comparable basis. Health & Wellness
achieved double-digit growth and Domestic
Appliances high-single-digit growth, while Personal
Care recorded low-single-digit growth. Growth
geographies achieved high-single-digit growth, driven
by strong growth in China, India and Middle East &
Turkey. Mature geographies recorded low-single-digit
growth, with mid-single-digit growth in Western Europe
and other mature geographies and low-single-digit
growth in North America.
Lighting sales amounted to EUR 6,869 million, which
was EUR 276 million lower than in 2013, or 3% lower on
a comparable basis. A high-single-digit decline at
Consumer Luminaires and mid-single-digit decline at
Light Sources & Electronics were tempered by low-
single-digit growth at Professional Lighting Solutions. A
low-single-digit decline was seen in mature