Philips 2014 Annual Report Download - page 86
Download and view the complete annual report
Please find page 86 of the 2014 Philips annual report below. You can navigate through the pages in the report by either clicking on the pages listed below, or by using the keyword search tool below to find specific information within the annual report.-
 1
1 -
2
-
3
-
4
-
5
-
6
-
7
-
8
-
9
-
10
-
11
-
12
-
13
-
14
-
15
-
16
-
17
-
18
-
19
-
20
-
21
-
22
-
23
-
24
-
25
-
26
-
27
-
28
-
29
-
30
-
31
-
32
-
33
-
34
-
35
-
36
-
37
-
38
-
39
-
40
-
41
-
42
-
43
-
44
-
45
-
46
-
47
-
48
-
49
-
50
-
51
-
52
-
53
-
54
-
55
-
56
-
57
-
58
-
59
-
60
-
61
-
62
-
63
-
64
-
65
-
66
-
67
-
68
-
69
-
70
-
71
-
72
-
73
-
74
-
75
-
 76
76 -
 77
77 -
 78
78 -
 79
79 -
 80
80 -
 81
81 -
 82
82 -
 83
83 -
 84
84 -
 85
85 -
 86
86 -
 87
87 -
 88
88 -
 89
89 -
 90
90 -
 91
91 -
 92
92 -
 93
93 -
 94
94 -
 95
95 -
 96
96 -
97
-
98
-
99
-
100
-
101
-
102
-
103
-
104
-
105
-
106
-
107
-
108
-
109
-
110
-
111
-
112
-
113
-
114
-
115
-
116
-
117
-
118
-
119
-
120
-
121
-
122
-
123
-
124
-
125
-
126
-
127
-
128
-
129
-
130
-
131
-
132
-
133
-
134
-
135
-
136
-
137
-
138
-
139
-
140
-
141
-
142
-
143
-
144
-
145
-
146
-
147
-
148
-
149
-
150
-
151
-
152
-
153
-
154
-
155
-
156
-
157
-
158
-
159
-
160
-
161
-
162
-
163
-
164
-
165
-
166
-
167
-
168
-
169
-
170
-
171
-
172
-
173
-
174
-
175
-
176
-
177
-
178
-
179
-
180
-
181
-
182
-
183
-
184
-
185
-
186
-
187
-
188
-
189
-
190
-
191
-
192
-
193
-
194
-
195
-
196
-
197
-
198
-
199
-
200
-
201
-
202
-
203
-
204
-
205
-
206
-
207
-
208
-
209
-
210
-
211
-
212
-
213
-
214
-
215
-
216
-
217
-
218
-
219
-
220
-
221
-
222
-
223
-
224
-
225
-
226
-
227
-
228
-
229
-
230
-
231
-
232
-
233
-
234
-
235
-
236
-
237
-
238
-
239
-
240
-
241
-
242
-
243
-
244
 |
 |

Supervisory Board report 10.2.7
86 Annual Report 2014
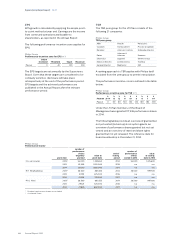
EPS
EPS growth is calculated by applying the simple point-
to-point method at year end. Earnings are the income
from continued operations attributable to
shareholders, as reported in the Annual Report.
The following performance-incentive zone applies for
EPS:
Philips Group
Performance-incentive zone for EPS in %
Below
threshold Threshold Target Maximum
Payout 0 40 100 200
The EPS targets are set annually by the Supervisory
Board. Given that these targets are considered to be
company sensitive, disclosure will take place
retrospectively at the end of the performance period.
EPS targets and the achieved performance are
published in the Annual Report after the relevant
performance period.
TSR
The TSR peer group for the LTI Plan consists of the
following 21 companies:
Philips Group
TSR peer group
ABB Hitachi Panasonic
Covidien Honeywell Int. Procter & Gamble
Danaher Johnson Controls Schneider Electric
Eaton
Johnson &
Johnson Siemens
Electrolux Legrand Smiths Group
Emerson Electric LG Electronics Toshiba
General Electric Medtronic 3M
A ranking approach to TSR applies with Philips itself
excluded from the peer group to permit interpolation.
The performance incentive-zone is outlined in the table
below:
Philips Group
Performance-incentive zone for TSR in %
Position
≥
21-14
≥
13
≥
12
≥
11
≥
10
≥
9
≥
8
≥
7
≥
6-1
Payout 0 60 60 100 120 140 160 180 200
Under the LTI Plan members of the Board of
Management were granted 117,936 performance shares
in 2014.
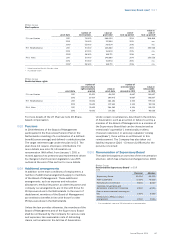
The following tables provide an overview of granted but
not yet vested (locked up) stock option grants, an
overview of performance shares granted but not yet
vested and an overview of restricted share rights
granted but not yet released. The reference date for
board membership is December 31, 2014.
Philips Group
Performance shares1)
grant date
number of
performance
shares
originally
granted
value at
grant date
end of
vesting
period
number of
performance
shares
vested in 2014
value
at vesting
date in 2014
F.A. van Houten 20132) 55,000 1,233,650 2014 55,000 1,425,600
2013 62,559 1,320,000 2016 n.a. n.a.
2014 59,075 1,380,000 2017 n.a. n.a.
R.H. Wirahadiraksa 20132) 38,500 863,555 2014 38,500 997,920
2013 31,991 675,000 2016 n.a. n.a.
2014 31,036 725,000 2017 n.a. n.a.
P.A.J. Nota 20132) 38,500 863,555 2014 38,500 997,920
2013 29,621 625,000 2016 n.a. n.a.
2014 27,825 650,000 2017 n.a. n.a.
1) Dividend performance shares not included
2) Accelerate! Grant