Philips 2014 Annual Report Download - page 25
Download and view the complete annual report
Please find page 25 of the 2014 Philips annual report below. You can navigate through the pages in the report by either clicking on the pages listed below, or by using the keyword search tool below to find specific information within the annual report.-
 1
1 -
2
-
3
-
4
-
5
-
6
-
7
-
8
-
9
-
10
-
11
-
12
-
13
-
14
-
 15
15 -
 16
16 -
 17
17 -
 18
18 -
 19
19 -
 20
20 -
 21
21 -
 22
22 -
 23
23 -
 24
24 -
 25
25 -
 26
26 -
 27
27 -
 28
28 -
 29
29 -
 30
30 -
 31
31 -
 32
32 -
 33
33 -
 34
34 -
 35
35 -
36
-
37
-
38
-
39
-
40
-
41
-
42
-
43
-
44
-
45
-
46
-
47
-
48
-
49
-
50
-
51
-
52
-
53
-
54
-
55
-
56
-
57
-
58
-
59
-
60
-
61
-
62
-
63
-
64
-
65
-
66
-
67
-
68
-
69
-
70
-
71
-
72
-
73
-
74
-
75
-
76
-
77
-
78
-
79
-
80
-
81
-
82
-
83
-
84
-
85
-
86
-
87
-
88
-
89
-
90
-
91
-
92
-
93
-
94
-
95
-
96
-
97
-
98
-
99
-
100
-
101
-
102
-
103
-
104
-
105
-
106
-
107
-
108
-
109
-
110
-
111
-
112
-
113
-
114
-
115
-
116
-
117
-
118
-
119
-
120
-
121
-
122
-
123
-
124
-
125
-
126
-
127
-
128
-
129
-
130
-
131
-
132
-
133
-
134
-
135
-
136
-
137
-
138
-
139
-
140
-
141
-
142
-
143
-
144
-
145
-
146
-
147
-
148
-
149
-
150
-
151
-
152
-
153
-
154
-
155
-
156
-
157
-
158
-
159
-
160
-
161
-
162
-
163
-
164
-
165
-
166
-
167
-
168
-
169
-
170
-
171
-
172
-
173
-
174
-
175
-
176
-
177
-
178
-
179
-
180
-
181
-
182
-
183
-
184
-
185
-
186
-
187
-
188
-
189
-
190
-
191
-
192
-
193
-
194
-
195
-
196
-
197
-
198
-
199
-
200
-
201
-
202
-
203
-
204
-
205
-
206
-
207
-
208
-
209
-
210
-
211
-
212
-
213
-
214
-
215
-
216
-
217
-
218
-
219
-
220
-
221
-
222
-
223
-
224
-
225
-
226
-
227
-
228
-
229
-
230
-
231
-
232
-
233
-
234
-
235
-
236
-
237
-
238
-
239
-
240
-
241
-
242
-
243
-
244
 |
 |

Group performance 5.1.5
Annual Report 2014 25
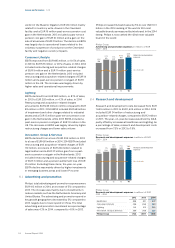
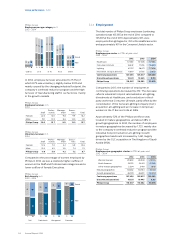
5.1.5 Pensions
In 2014, the total costs of post-employment benets
amounted to EUR 241 million for dened-benet plans
and EUR 144 million for dened-contribution plans,
compared to EUR 291 million and EUR 134 million
respectively in 2013.
The above costs are reported in Operating expenses
except for the net interest cost component which is
reported in Financial income and expense. The net
interest cost for dened-benet plans was EUR 59
million in 2014 (2013: EUR 71 million).
2014 included past-service cost gains in the
Netherlands of EUR 67 million, which were mainly
related to the mandatory plan change in the
Netherlands, where a salary cap of EUR 100,000 must
be applied to the pension salary with eect from
January 1, 2015. This change lowers the Company’s
Dened Benet Obligation which is recognized as a
past-service cost gain. Compensatory measures are
given in wages for employees impacted.
2013 included past-service cost gains of EUR 81 million,
which included EUR 78 million related to the
announced freeze of accrual after December 31, 2015
for salaried workers in the Company’s US dened-
benet pension plan. In the same US plan a settlement
loss of EUR 31 million was recognized in 2013 following
a lump-sum oering to terminated vested employees.
This oering resulted in settling the pension obligations
towards these employees. The past-service cost gain is
allocated to the respective sectors of the US employees
involved, whereas the settlement loss is allocated fully
to Pensions in IG&S as it related to inactive employees.
The overall funded status of our dened-benet
pension plans in 2014 decreased compared to 2013 due
to a decrease in discount rates used to measure the
dened benet obligation. The decits recognized on
our balance sheet increased by approximately EUR 393
million due to lower discount rates in the US and
Germany and a new adopted mortality table in the US.
In 2014, further progress was made in managing the
nancial exposure to dened-benet plans by two
further buy-ins in the UK plan.
For further information, refer to Post-employment
benets.
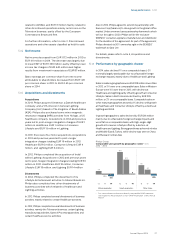
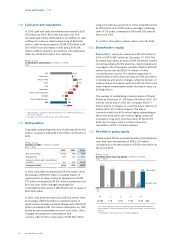
5.1.6 Restructuring and impairment charges
In 2014, EBIT included net charges totaling EUR 414
million for restructuring. In addition to the annual
goodwill-impairment tests for Philips, trigger-based
impairment tests were performed during the year,
resulting in a goodwill impairment of EUR 1 million at
Healthcare and EUR 2 million at Lighting.
2013 included EUR 84 million of restructuring charges
and a goodwill impairment of EUR 26 million at
Consumer Luminaires, mainly as a consequence of
reduced growth rates resulting from a slower-than-
anticipated recovery of certain markets, as well as
delays in the introduction of new product ranges.
For further information on sensitivity analysis, please
refer to note 11, Goodwill.
In 2014, the most signicant restructuring projects
related to Lighting and IG&S and were driven by
industrial footprint rationalization and the Accelerate!
transformation program. Restructuring projects at
Lighting centered on Light Sources & Electronics and
Professional Lighting Solutions, the largest of which
took place in the Belgium, Netherlands and France.
Innovation, Group & Services restructuring projects
mainly were related to IT and group and country
overheads and centered primarily on the Netherlands,
US and Belgium. Restructuring projects at Healthcare
mainly took place in the US and the Netherlands.
Consumer Lifestyle restructuring projects were mainly
in the Netherlands.
In 2013, the more signicant restructuring projects were
related to industrial footprint rationalization at Lighting.
The largest projects were centered at Consumer
Luminaires and Light Sources & Electronics, mainly in
the Unites States, France and Belgium. Innovation
Group & Services restructuring projects were largely
focused on the Financial Operations Service Units,
primarily in Italy, France and the United States.
Restructuring projects at Consumer Lifestyle were
mainly seen at Personal Care in the Netherlands and
Austria and Coee in Italy.
For further information on restructuring, refer to note 19,
Provisions.
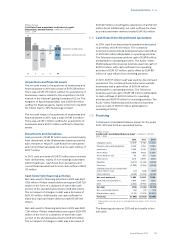
Philips Group
Restructuring and related charges in millions of EUR
2012 - 2014
2012 2013 2014
Restructuring and related charges per
sector:
Healthcare 116 (6) 68
Consumer Lifestyle 38 10 8
Lighting 294 77 225
Innovation, Group & Services 56 3 113
Continuing operations 504 84 414
Discontinued operations 36 33 18
Cost breakdown of restructuring and
related charges:
Personnel lay-o costs 414 95 354
Release of provision (33) (62) (36)
Restructuring-related asset
impairment 66 25 57
Other restructuring-related costs 57 26 39
Continuing operations 504 84 414
Discontinued operations 36 33 18