Philips 2014 Annual Report Download - page 170
Download and view the complete annual report
Please find page 170 of the 2014 Philips annual report below. You can navigate through the pages in the report by either clicking on the pages listed below, or by using the keyword search tool below to find specific information within the annual report.-
 1
1 -
2
-
3
-
4
-
5
-
6
-
7
-
8
-
9
-
10
-
11
-
12
-
13
-
14
-
15
-
16
-
17
-
18
-
19
-
20
-
21
-
22
-
23
-
24
-
25
-
26
-
27
-
28
-
29
-
30
-
31
-
32
-
33
-
34
-
35
-
36
-
37
-
38
-
39
-
40
-
41
-
42
-
43
-
44
-
45
-
46
-
47
-
48
-
49
-
50
-
51
-
52
-
53
-
54
-
55
-
56
-
57
-
58
-
59
-
60
-
61
-
62
-
63
-
64
-
65
-
66
-
67
-
68
-
69
-
70
-
71
-
72
-
73
-
74
-
75
-
76
-
77
-
78
-
79
-
80
-
81
-
82
-
83
-
84
-
85
-
86
-
87
-
88
-
89
-
90
-
91
-
92
-
93
-
94
-
95
-
96
-
97
-
98
-
99
-
100
-
101
-
102
-
103
-
104
-
105
-
106
-
107
-
108
-
109
-
110
-
111
-
112
-
113
-
114
-
115
-
116
-
117
-
118
-
119
-
120
-
121
-
122
-
123
-
124
-
125
-
126
-
127
-
128
-
129
-
130
-
131
-
132
-
133
-
134
-
135
-
136
-
137
-
138
-
139
-
140
-
141
-
142
-
143
-
144
-
145
-
146
-
147
-
148
-
149
-
150
-
151
-
152
-
153
-
154
-
155
-
156
-
157
-
158
-
159
-
 160
160 -
 161
161 -
 162
162 -
 163
163 -
 164
164 -
 165
165 -
 166
166 -
 167
167 -
 168
168 -
 169
169 -
 170
170 -
 171
171 -
 172
172 -
 173
173 -
 174
174 -
 175
175 -
 176
176 -
 177
177 -
 178
178 -
 179
179 -
 180
180 -
181
-
182
-
183
-
184
-
185
-
186
-
187
-
188
-
189
-
190
-
191
-
192
-
193
-
194
-
195
-
196
-
197
-
198
-
199
-
200
-
201
-
202
-
203
-
204
-
205
-
206
-
207
-
208
-
209
-
210
-
211
-
212
-
213
-
214
-
215
-
216
-
217
-
218
-
219
-
220
-
221
-
222
-
223
-
224
-
225
-
226
-
227
-
228
-
229
-
230
-
231
-
232
-
233
-
234
-
235
-
236
-
237
-
238
-
239
-
240
-
241
-
242
-
243
-
244
 |
 |
Group nancial statements 12.9
170 Annual Report 2014
Philips Group
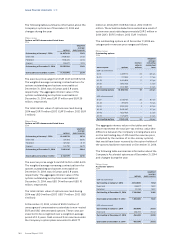
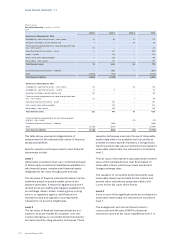
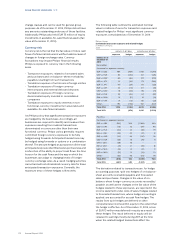
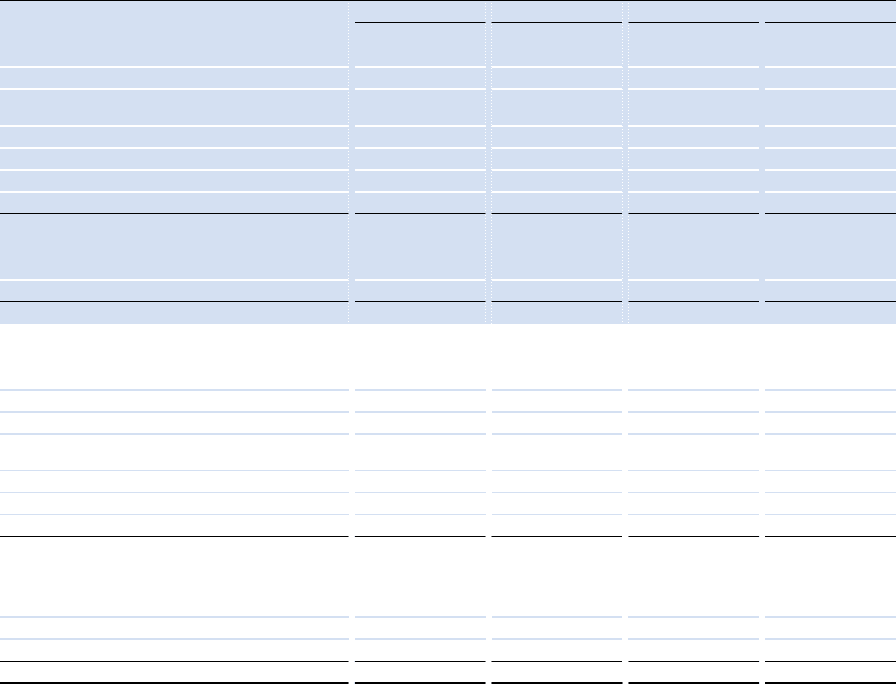
Fair value hierarchy in millions of EUR
2014
level 1 level 2 level 3 total
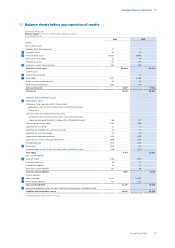
Balance as of December 31, 2014
Available-for-sale nancial assets - non-current 51 43 21 115
Securities classied as assets held for sale 1 – 37 38
Financial assets designated at fair value through prot and
loss - non-current 24 – – 24
Derivative nancial instruments - assets – 207 – 207
Loans - current – 125 – 125
Non-current loans and receivables – 86 – 86
Receivables - non-current – 177 – 177
Total nancial assets 76 638 58 772
Derivative nancial instruments - liabilities – (857) – (857)
Debt (3,969) (195) – (4,164)
Total nancial liabilities (3,969) (1,052) – (5,021)
Balance as of December 31, 2013
Available-for-sale nancial assets - non-current 42 – 54 96
Available-for-sale nancial assets - current 6 4 – 10
Securities classied as assets held for sale 62 – – 62
Financial assets designated at fair value through prot and
loss - non-current 22 – 7 29
Derivative nancial instruments - assets – 150 – 150
Non-current loans and receivables – 143 – 143
Receivables - non-current – 144 – 144
Total nancial assets 132 441 61 634
Financial liabilities designated at fair value through prot
and loss - non-current – – (13) (13)
Derivative nancial instruments - liabilities – (368) – (368)
Debt (3,345) (200) – (3,545)
Total nancial liabilities (3,345) (568) (13) (3,926)
The table above represents categorization of
measurement of the estimated fair values of nancial
assets and liabilities.
Specic valuation techniques used to value nancial
instruments include:
Level 1
Instruments included in level 1 are comprised primarily
of listed equity investments classied as available-for-
sale nancial assets, investees and nancial assets
designated at fair value through prot and loss.
The fair value of nancial instruments traded in active
markets is based on quoted market prices at the
balance sheet date. A market is regarded as active if
quoted prices are readily and regularly available from
an exchange, dealer, broker, industry group, pricing
service, or regulatory agency, and those prices
represent actual and regularly occurring market
transactions on an arm’s length basis.
Level 2
The fair value of nancial instruments that are not
traded in an active market (for example, over-the-
counter derivatives or convertible bond instruments)
are determined by using valuation techniques. These
valuation techniques maximize the use of observable
market data where it is available and rely as little as
possible on entity-specic estimates. If all signicant
inputs required to fair value an instrument are based on
observable market data, the instrument is included in
level 2.
The fair value of derivatives is calculated as the present
value of the estimated future cash ows based on
observable interest yield curves, basis spread and
foreign exchange rates.
The valuation of convertible bond instruments uses
observable market quoted data for the options and
present value calculations using observable yield
curves for the fair value of the bonds.
Level 3
If one or more of the signicant inputs are not based on
observable market data, the instrument is included in
level 3.
The arrangement with the UK Pension Fund in
conjunction with the sale of NXP is a nancial
instrument carried at fair value classied as level 3. In