Philips 2014 Annual Report Download - page 147
Download and view the complete annual report
Please find page 147 of the 2014 Philips annual report below. You can navigate through the pages in the report by either clicking on the pages listed below, or by using the keyword search tool below to find specific information within the annual report.-
 1
1 -
2
-
3
-
4
-
5
-
6
-
7
-
8
-
9
-
10
-
11
-
12
-
13
-
14
-
15
-
16
-
17
-
18
-
19
-
20
-
21
-
22
-
23
-
24
-
25
-
26
-
27
-
28
-
29
-
30
-
31
-
32
-
33
-
34
-
35
-
36
-
37
-
38
-
39
-
40
-
41
-
42
-
43
-
44
-
45
-
46
-
47
-
48
-
49
-
50
-
51
-
52
-
53
-
54
-
55
-
56
-
57
-
58
-
59
-
60
-
61
-
62
-
63
-
64
-
65
-
66
-
67
-
68
-
69
-
70
-
71
-
72
-
73
-
74
-
75
-
76
-
77
-
78
-
79
-
80
-
81
-
82
-
83
-
84
-
85
-
86
-
87
-
88
-
89
-
90
-
91
-
92
-
93
-
94
-
95
-
96
-
97
-
98
-
99
-
100
-
101
-
102
-
103
-
104
-
105
-
106
-
107
-
108
-
109
-
110
-
111
-
112
-
113
-
114
-
115
-
116
-
117
-
118
-
119
-
120
-
121
-
122
-
123
-
124
-
125
-
126
-
127
-
128
-
129
-
130
-
131
-
132
-
133
-
134
-
135
-
136
-
 137
137 -
 138
138 -
 139
139 -
 140
140 -
 141
141 -
 142
142 -
 143
143 -
 144
144 -
 145
145 -
 146
146 -
 147
147 -
 148
148 -
 149
149 -
 150
150 -
 151
151 -
 152
152 -
 153
153 -
 154
154 -
 155
155 -
 156
156 -
 157
157 -
158
-
159
-
160
-
161
-
162
-
163
-
164
-
165
-
166
-
167
-
168
-
169
-
170
-
171
-
172
-
173
-
174
-
175
-
176
-
177
-
178
-
179
-
180
-
181
-
182
-
183
-
184
-
185
-
186
-
187
-
188
-
189
-
190
-
191
-
192
-
193
-
194
-
195
-
196
-
197
-
198
-
199
-
200
-
201
-
202
-
203
-
204
-
205
-
206
-
207
-
208
-
209
-
210
-
211
-
212
-
213
-
214
-
215
-
216
-
217
-
218
-
219
-
220
-
221
-
222
-
223
-
224
-
225
-
226
-
227
-
228
-
229
-
230
-
231
-
232
-
233
-
234
-
235
-
236
-
237
-
238
-
239
-
240
-
241
-
242
-
243
-
244
 |
 |

Group nancial statements 12.9
Annual Report 2014 147
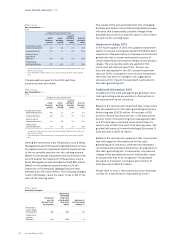
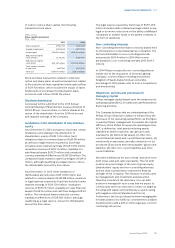
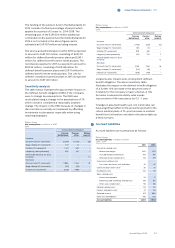
In order to reduce share capital, the following
transactions took place:
Philips Group
Share capital transactions
2013 - 2014
2013 2014
Shares acquired 27,807,372 21,283,315
Average market price EUR 22.69 EUR 23.95
Amount paid EUR 631 million EUR 510 million
Reduction of capital
stock (shares) 37,778,510 21,837,910
Reduction of capital
stock (EUR) EUR 787 million EUR 533 million
Total shares in treasury
at year-end 3,857,595 3,303,000
Total cost EUR 100 million EUR 77 million
Stock purchase transactions related to employee
option and share plans, as well as transactions related
to the reduction of share capital involved a cash outow
of EUR 712 million, which includes the impact of taxes.
Settlements of stock based compensation plans
involved a cash inow of EUR 116 million.
Dividend distribution
A proposal will be submitted to the 2015 Annual
General Meeting of Shareholders to pay a dividend of
EUR 0.80 per common share, in cash or shares at the
option of the shareholder, from the 2014 net income
and retained earnings of the Company.
Limitations in the distribution of shareholders’
equity
As at December 31, 2014, pursuant to Dutch law, certain
limitations exist relating to the distribution of
shareholders’ equity of EUR 1,515 million. Such
limitations relate to common shares of EUR 187 million,
as well as to legal reserves required by Dutch law
included under retained earnings of EUR 1,059 million,
revaluation reserves of EUR 13 million, available-for-
sale nancial assets EUR 27 million and unrealized
currency translation dierences of EUR 229 million. The
unrealized losses related to cash ow hedges of EUR 13
million, although qualifying as a legal reserve, reduce
the distributable amount by their nature.
As at December 31, 2013, these limitations in
distributable amounts were EUR 1,609 million and
related to common shares of EUR 188 million, as well as
to legal reserves required by Dutch law included under
retained earnings of EUR 1,319 million, revaluation
reserves of EUR 23 million, available-for-sale nancial
assets of EUR 55 million and cash ow hedges EUR 24
million. The unrealized losses related to currency
translation dierences of EUR 569 million, although
qualifying as a legal reserve, reduce the distributable
amount by their nature.
The legal reserve required by Dutch law of EUR 1,059
million included under retained earnings relates to any
legal or economic restrictions on the ability of aliated
companies to transfer funds to the parent company in
the form of dividends.
Non-controlling interests
Non-controlling interests relate to minority stakes held
by third parties in consolidated group companies. The
Net loss attributable to non-controlling interests
amounted to EUR 4 million in 2014 (Net income
attributable to non-controlling interests 2013: EUR 3
million).
In 2014 Philips increased its non-controlling interest
mainly due to the acquisition of General Lighting
Company, in which Alliance Holding domiciled in
Kingdom of Saudi Arabia holds an ownership
percentage of 49% (please refer to note 4, Acquisitions
and divestments).
Objectives, policies and processes for
managing capital
Philips manages capital based upon the measures net
operating capital (NOC), net debt and cash ows before
nancing activities.
The Company believes that an understanding of the
Philips Group’s nancial condition is enhanced by the
disclosure of net operating capital (NOC), as this gure
is used by Philips’ management to evaluate the capital
eciency of the Philips Group and its operating sectors.
NOC is dened as: total assets excluding assets
classied as held for sale less: (a) cash and cash
equivalents, (b) deferred tax assets, (c) other non-
current nancial assets and current nancial assets, (d)
investments in associates, and after deduction of: (e)
provisions (f) accounts and notes payable, (g) accrued
liabilities, (h) other non-current liabilities and other
current liabilities.
Net debt is dened as the sum of long- and short-term
debt minus cash and cash equivalents. The net debt
position as a percentage of the sum of group equity
(shareholders’ equity and non-controlling interests)
and net debt is presented to express the nancial
strength of the Company. This measure is widely used
by management and investment analysts and is
therefore included in the disclosure. Our net debt
position is managed in such a way that we expect to
continuously meet our objective to retain our target at
A3 rating with stable outlook (Moody’s,) and A-rating
with negative outlook (Standard and Poor’s).
Furthermore, the Group’s objective when managing the
net debt position is to fulll our commitment to a stable
dividend policy with a 40% to 50% target pay-out from
continuing net income.