Philips 2014 Annual Report Download - page 139
Download and view the complete annual report
Please find page 139 of the 2014 Philips annual report below. You can navigate through the pages in the report by either clicking on the pages listed below, or by using the keyword search tool below to find specific information within the annual report.-
 1
1 -
2
-
3
-
4
-
5
-
6
-
7
-
8
-
9
-
10
-
11
-
12
-
13
-
14
-
15
-
16
-
17
-
18
-
19
-
20
-
21
-
22
-
23
-
24
-
25
-
26
-
27
-
28
-
29
-
30
-
31
-
32
-
33
-
34
-
35
-
36
-
37
-
38
-
39
-
40
-
41
-
42
-
43
-
44
-
45
-
46
-
47
-
48
-
49
-
50
-
51
-
52
-
53
-
54
-
55
-
56
-
57
-
58
-
59
-
60
-
61
-
62
-
63
-
64
-
65
-
66
-
67
-
68
-
69
-
70
-
71
-
72
-
73
-
74
-
75
-
76
-
77
-
78
-
79
-
80
-
81
-
82
-
83
-
84
-
85
-
86
-
87
-
88
-
89
-
90
-
91
-
92
-
93
-
94
-
95
-
96
-
97
-
98
-
99
-
100
-
101
-
102
-
103
-
104
-
105
-
106
-
107
-
108
-
109
-
110
-
111
-
112
-
113
-
114
-
115
-
116
-
117
-
118
-
119
-
120
-
121
-
122
-
123
-
124
-
125
-
126
-
127
-
128
-
 129
129 -
 130
130 -
 131
131 -
 132
132 -
 133
133 -
 134
134 -
 135
135 -
 136
136 -
 137
137 -
 138
138 -
 139
139 -
 140
140 -
 141
141 -
 142
142 -
 143
143 -
 144
144 -
 145
145 -
 146
146 -
 147
147 -
 148
148 -
 149
149 -
150
-
151
-
152
-
153
-
154
-
155
-
156
-
157
-
158
-
159
-
160
-
161
-
162
-
163
-
164
-
165
-
166
-
167
-
168
-
169
-
170
-
171
-
172
-
173
-
174
-
175
-
176
-
177
-
178
-
179
-
180
-
181
-
182
-
183
-
184
-
185
-
186
-
187
-
188
-
189
-
190
-
191
-
192
-
193
-
194
-
195
-
196
-
197
-
198
-
199
-
200
-
201
-
202
-
203
-
204
-
205
-
206
-
207
-
208
-
209
-
210
-
211
-
212
-
213
-
214
-
215
-
216
-
217
-
218
-
219
-
220
-
221
-
222
-
223
-
224
-
225
-
226
-
227
-
228
-
229
-
230
-
231
-
232
-
233
-
234
-
235
-
236
-
237
-
238
-
239
-
240
-
241
-
242
-
243
-
244
 |
 |

9Group nancial statements 12.9
Annual Report 2014 139
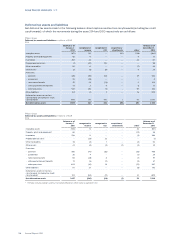
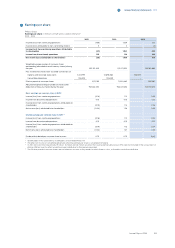
9Earnings per share
Philips Group
Earnings per share in millions of EUR unless stated otherwise1)
2012 - 2014
2012 2013 2014
Income (loss) from continuing operations (166) 1,034 221
Income (loss) attributable to non-controlling interest 5 3 (4)
Income (loss) from continuing operations attributable
to shareholders (171) 1,031 225
Income from discontinued operations 136 138 190
Net income (loss) attributable to shareholders (35) 1,169 415
Weighted average number of common shares
outstanding (after deduction of treasury shares) during
the year 922,101,005 911,071,970 915,192,683
Plus incremental shares from assumed conversions of:
Options and restricted share rights 5,014,991 10,896,583 7,521,591
Convertible debentures 106,204 103,899 –
Dilutive potential common shares 5,121,195 11,000,482 7,521,591
Adjusted weighted average number of shares (after
deduction of treasury shares) during the year 927,222,200 922,072,452 922,714,274
Basic earnings per common share in EUR2)
Income (loss) from continuing operations (0.18) 1.13 0.24
Income from discontinued operations 0.15 0.15 0.21
Income (loss) from continuing operations attributable to
shareholders (0.19) 1.13 0.25
Net income (loss) attributable to shareholders (0.04) 1.28 0.45
Diluted earnings per common share in EUR2,3,4)
Income (loss) from continuing operations (0.18) 1.12 0.24
Income from discontinued operations 0.15 0.15 0.21
Income (loss) from continuing operations attributable to
shareholders (0.19) 1.12 0.24
Net income (loss) attributable to shareholders (0.04) 1.27 0.45
Dividend distributed per common share in euros 0.75 0.75 0.80
1) Shareholders in this table refer to shareholders of Koninklijke Philips N.V.
2) The eect on income of convertible debentures aecting earnings per share is considered immaterial
3) In 2014, 2013 and 2012, respectively 19 million, 14 million and 36 million securities that could potentially dilute basic EPS were not included in the computation of
dilutive EPS because the eect would have been antidilutive for the periods presented
4) The Dilutive potential common shares are not taken into account in the periods for which there is a loss, as the eect would be antidilutive