Philips 2014 Annual Report Download - page 28
Download and view the complete annual report
Please find page 28 of the 2014 Philips annual report below. You can navigate through the pages in the report by either clicking on the pages listed below, or by using the keyword search tool below to find specific information within the annual report.-
 1
1 -
2
-
3
-
4
-
5
-
6
-
7
-
8
-
9
-
10
-
11
-
12
-
13
-
14
-
15
-
16
-
17
-
 18
18 -
 19
19 -
 20
20 -
 21
21 -
 22
22 -
 23
23 -
 24
24 -
 25
25 -
 26
26 -
 27
27 -
 28
28 -
 29
29 -
 30
30 -
 31
31 -
 32
32 -
 33
33 -
 34
34 -
 35
35 -
 36
36 -
 37
37 -
 38
38 -
39
-
40
-
41
-
42
-
43
-
44
-
45
-
46
-
47
-
48
-
49
-
50
-
51
-
52
-
53
-
54
-
55
-
56
-
57
-
58
-
59
-
60
-
61
-
62
-
63
-
64
-
65
-
66
-
67
-
68
-
69
-
70
-
71
-
72
-
73
-
74
-
75
-
76
-
77
-
78
-
79
-
80
-
81
-
82
-
83
-
84
-
85
-
86
-
87
-
88
-
89
-
90
-
91
-
92
-
93
-
94
-
95
-
96
-
97
-
98
-
99
-
100
-
101
-
102
-
103
-
104
-
105
-
106
-
107
-
108
-
109
-
110
-
111
-
112
-
113
-
114
-
115
-
116
-
117
-
118
-
119
-
120
-
121
-
122
-
123
-
124
-
125
-
126
-
127
-
128
-
129
-
130
-
131
-
132
-
133
-
134
-
135
-
136
-
137
-
138
-
139
-
140
-
141
-
142
-
143
-
144
-
145
-
146
-
147
-
148
-
149
-
150
-
151
-
152
-
153
-
154
-
155
-
156
-
157
-
158
-
159
-
160
-
161
-
162
-
163
-
164
-
165
-
166
-
167
-
168
-
169
-
170
-
171
-
172
-
173
-
174
-
175
-
176
-
177
-
178
-
179
-
180
-
181
-
182
-
183
-
184
-
185
-
186
-
187
-
188
-
189
-
190
-
191
-
192
-
193
-
194
-
195
-
196
-
197
-
198
-
199
-
200
-
201
-
202
-
203
-
204
-
205
-
206
-
207
-
208
-
209
-
210
-
211
-
212
-
213
-
214
-
215
-
216
-
217
-
218
-
219
-
220
-
221
-
222
-
223
-
224
-
225
-
226
-
227
-
228
-
229
-
230
-
231
-
232
-
233
-
234
-
235
-
236
-
237
-
238
-
239
-
240
-
241
-
242
-
243
-
244
 |
 |

Group performance 5.1.15
28 Annual Report 2014
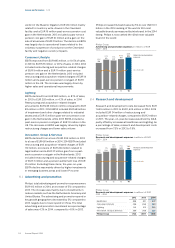
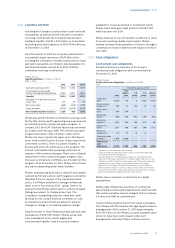
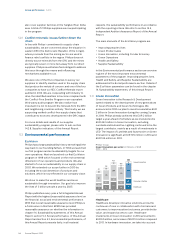
Philips Group
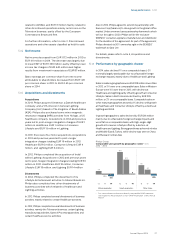
Sales by geographic cluster in millions of EUR
2012 - 2014
5,686
7,340
1,821
7,387
22,234
‘12
5,680
6,883
1,759
7,668
21,990
‘13
5,665 Western Europe
6,678 North America
1,661 Other mature
7,387 Growth
21,391
‘14
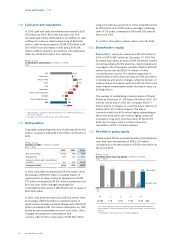
5.1.15 Cash ows provided by continuing
operations
Cash ows from operating activities
Net cash ows from operating activities amounted to
EUR 1,303 million in 2014, which was EUR 391 million
higher than in 2013, mainly due to higher inows from
working capital reductions.
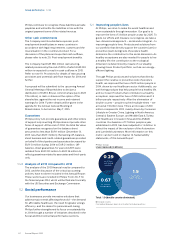
Philips Group
Cash ows from operating activities and net capital
expenditures in millions of EUR
2010 - 2014
1,691
(543)
‘10
610
(663)
‘11
1,886
(241)
‘12
912
(830)
‘13
1,303 Cash flows from operating
activities
(806) Net capital expenditures
‘14
Condensed consolidated statements of cash ows for
the years ended December 31, 2012, 2013 and 2014 are
presented below:
Philips Group
Condensed consolidated cash ow statements1)
in millions of EUR
2012 - 2014
2012 2013 2014
Net income (loss) (30) 1,172 411
Adjustments to reconcile net income
to net cash provided by operating
activities 1,916 (260) 892
Net cash provided by operating
activities 1,886 912 1,303
Net cash used for investing activities (712) (862) (984)
Cash ows before nancing
activities2) 1,174 50 319
Net cash used for nancing activities (293) (1,241) (1,189)
Cash (used for) provided by
continuing operations 881 (1,191) (870)
Net cash (used for) provided by
discontinued operations (143) (115) 193
Eect of changes in exchange rates
on cash and cash equivalents (51) (63) 85
Total change in cash and cash
equivalents 687 (1,369) (592)
Cash and cash equivalents at the
beginning of year 3,147 3,834 2,465
Cash and cash equivalents at the
end of year 3,834 2,465 1,873
1) Please refer to section 12.7, Consolidated statements of cash ows, of
this Annual Report
2) Please refer to chapter 15, Reconciliation of non-GAAP information, of
this Annual Report
Cash ows from investing activities
In 2014, cash ows from investing activities resulted in
a net outow of EUR 984 million. This was attributable
to EUR 806 million cash used for net capital
expenditures, EUR 258 million used for acquisitions of
businesses and non-current nancial assets, and EUR
7 million used for derivatives and current nancial
assets, partly oset by EUR 87 million of net proceeds
from non-current nancial assets and divestments.
In 2013, cash ows from investing activities resulted in
a net outow of EUR 862 million. This was attributable
to EUR 830 million cash used for net capital
expenditures, EUR 101 million cash used for derivatives
and current nancial assets, as well as EUR 24 million
used for acquisitions of businesses and non-current
nancial assets, partly oset by EUR 93 million of net
proceeds mainly from divestment.
Net capital expenditures
Net capital expenditures amounted to a cash outow
of EUR 806 million, compared to an outow of EUR 830
million in 2013. The year-on-year decrease was mainly
due to lower investments at Healthcare and Lighting.