Philips 2014 Annual Report Download - page 210
Download and view the complete annual report
Please find page 210 of the 2014 Philips annual report below. You can navigate through the pages in the report by either clicking on the pages listed below, or by using the keyword search tool below to find specific information within the annual report.-
 1
1 -
2
-
3
-
4
-
5
-
6
-
7
-
8
-
9
-
10
-
11
-
12
-
13
-
14
-
15
-
16
-
17
-
18
-
19
-
20
-
21
-
22
-
23
-
24
-
25
-
26
-
27
-
28
-
29
-
30
-
31
-
32
-
33
-
34
-
35
-
36
-
37
-
38
-
39
-
40
-
41
-
42
-
43
-
44
-
45
-
46
-
47
-
48
-
49
-
50
-
51
-
52
-
53
-
54
-
55
-
56
-
57
-
58
-
59
-
60
-
61
-
62
-
63
-
64
-
65
-
66
-
67
-
68
-
69
-
70
-
71
-
72
-
73
-
74
-
75
-
76
-
77
-
78
-
79
-
80
-
81
-
82
-
83
-
84
-
85
-
86
-
87
-
88
-
89
-
90
-
91
-
92
-
93
-
94
-
95
-
96
-
97
-
98
-
99
-
100
-
101
-
102
-
103
-
104
-
105
-
106
-
107
-
108
-
109
-
110
-
111
-
112
-
113
-
114
-
115
-
116
-
117
-
118
-
119
-
120
-
121
-
122
-
123
-
124
-
125
-
126
-
127
-
128
-
129
-
130
-
131
-
132
-
133
-
134
-
135
-
136
-
137
-
138
-
139
-
140
-
141
-
142
-
143
-
144
-
145
-
146
-
147
-
148
-
149
-
150
-
151
-
152
-
153
-
154
-
155
-
156
-
157
-
158
-
159
-
160
-
161
-
162
-
163
-
164
-
165
-
166
-
167
-
168
-
169
-
170
-
171
-
172
-
173
-
174
-
175
-
176
-
177
-
178
-
179
-
180
-
181
-
182
-
183
-
184
-
185
-
186
-
187
-
188
-
189
-
190
-
191
-
192
-
193
-
194
-
195
-
196
-
197
-
198
-
199
-
 200
200 -
 201
201 -
 202
202 -
 203
203 -
 204
204 -
 205
205 -
 206
206 -
 207
207 -
 208
208 -
 209
209 -
 210
210 -
 211
211 -
 212
212 -
 213
213 -
 214
214 -
 215
215 -
 216
216 -
 217
217 -
 218
218 -
 219
219 -
 220
220 -
221
-
222
-
223
-
224
-
225
-
226
-
227
-
228
-
229
-
230
-
231
-
232
-
233
-
234
-
235
-
236
-
237
-
238
-
239
-
240
-
241
-
242
-
243
-
244
 |
 |

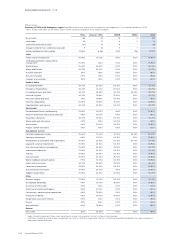
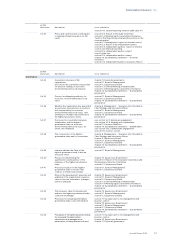
Sustainability statements 14.3.3
210 Annual Report 2014
Philips Group
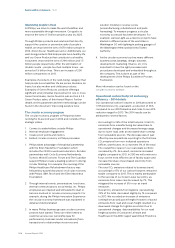
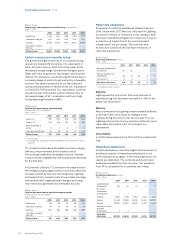
Total energy consumption in manufacturing in terajoules
2010 - 2014
2010 2011 2012 2013 2014
Healthcare 1,545 1,541 1,798 1,794 1,773
Consumer Lifestyle 1,274 1,252 1,104 1,142 1,115
Lighting 9,618 9,237 9,112 9,027 8,369
Innovation, Group &
Services 27 – – – –
Philips Group 12,464 12,030 12,014 11,963 11,257
Carbon emissions in manufacturing
The greenhouse gas emissions of our manufacturing
operations totaled 474 kilotonnes CO2-equivalent in
2014, 10% lower than in 2013. This is the result of the
decreased energy usage, operational changes, partly
oset with new acquisitions reporting for the rst time.
Indirect CO2 emissions overall decreased mainly due to
increased usage of electricity generated by renewable
sources. The carbon emissions of our discontinued
operations amounted to 144 kilotonnes CO2-equivalent
in 2014 (2013: 187 kilotonnes CO2-equivalent). Lumileds
operations also reduced the carbon emission due to
decreased usage of SF6, a substance with very high
Global Warming Potential (GWP).
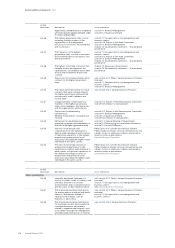
Philips Group
Total carbon emissions in manufacturing
in kilotonnes CO2-equivalent
2010 - 2014
2010 2011 2012 2013 2014
Direct CO2 1) 295 290 278 276 253
Indirect CO2287 238 253 214 191
Other greenhouse
gases 5 4 6 7 6
From glass production 25 28 27 27 24
Philips Group2) 612 560 564 524 474
1) From energy
2) Excluding new acquisitions therefore dierent from Operational carbon
footprint
CO2 emissions decreased at Healthcare due to energy
eciency improvements and increased use of
electricity generated by renewable sources; this was
however partly mitigated by new acquisitions reporting
for the rst time.
At Consumer Lifestyle, CO2 emissions decreased due to
the energy saving programs which more than oset the
increase caused by two new reporting sites. Lighting
decreased its CO2 emissions due to lower load of energy
intense activities, organizational changes and using
more electricity generated by renewable sources.
Philips Group
Total carbon emissions in manufacturing per sector
in kilotonnes CO2-equivalent
2010 - 2014
2010 2011 2012 2013 2014
Healthcare 60 56 79 58 52
Consumer Lifestyle 44 41 39 38 34
Lighting 507 463 446 428 388
Innovation, Group &
Services 1 – – – –
Philips Group 612 560 564 524 474
Restricted substances
Emissions of restricted substances totaled 9 kilos in
2014, on par with 2013. Mercury, only used in Lighting,
accounts for 8 kilos of emissions in this category. With
the Green Operations program we continue to focus on
a reduction of a selection of the most important
substances in our processes. The Lumileds and
Automotive operations did not have emissions of
restricted substances.
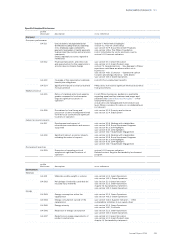
Philips Group
Restricted substances in kilos
2010 - 2014
2010 2011 2012 2013 2014
Benzene and Benzene
compounds 101 55 – – –
Mercury and Mercury
Compounds 83 51 54 8 8
CFCs/HCFCs1) 4 5 1 1 1
Restricted substances 188 111 55 9 9
1) Excluding cooling systems
Benzene
Lighting was the only sector that used benzene in
manufacturing, but has been successful in 2012 in the
phase out of benzene.
Mercury
Mercury emissions in Lighting remained stable at 8 kilos
in 2013 and 2014. As a result of changes in the
manufacturing process, for the second year in a row,
Lighting achieved its mercury emission at the as low as
reasonably achievable level, according to our
assessment.
CFCs/HCFCs
In 2014 total emissions from CFCs/HCFCs remained at
1 kg.
Hazardous substances
As described above, reduction targets have been set on
a selected number of hazardous substances in our
Green Operations program. In the following section our
results are described. The Lumileds and Automotive
data was excluded from the overview. The emissions
from PFCs is material for a Lumileds site in Asia.
Philips Group
Hazardous substances in kilos
2010 - 2014
2010 2011 2012 2013 2014
Lead and lead
compounds 108 44 73 1 8
PFCs (Per
Fluorinated
Compounds) 1 1 – – –
Toluene 6,745 5,745 6,184 1,188 162
Xylene 30,491 37,889 18,944 28,176 22,979
Styrene 22,920 19,920 42,329 5,753 5,161
Antimony, Arsenic
and their
compounds 7 5 – – –
Hazardous
substances 60,272 63,604 67,530 35,118 28,310