Philips 2014 Annual Report Download - page 38
Download and view the complete annual report
Please find page 38 of the 2014 Philips annual report below. You can navigate through the pages in the report by either clicking on the pages listed below, or by using the keyword search tool below to find specific information within the annual report.-
 1
1 -
2
-
3
-
4
-
5
-
6
-
7
-
8
-
9
-
10
-
11
-
12
-
13
-
14
-
15
-
16
-
17
-
18
-
19
-
20
-
21
-
22
-
23
-
24
-
25
-
26
-
27
-
 28
28 -
 29
29 -
 30
30 -
 31
31 -
 32
32 -
 33
33 -
 34
34 -
 35
35 -
 36
36 -
 37
37 -
 38
38 -
 39
39 -
 40
40 -
 41
41 -
 42
42 -
 43
43 -
 44
44 -
 45
45 -
 46
46 -
 47
47 -
 48
48 -
49
-
50
-
51
-
52
-
53
-
54
-
55
-
56
-
57
-
58
-
59
-
60
-
61
-
62
-
63
-
64
-
65
-
66
-
67
-
68
-
69
-
70
-
71
-
72
-
73
-
74
-
75
-
76
-
77
-
78
-
79
-
80
-
81
-
82
-
83
-
84
-
85
-
86
-
87
-
88
-
89
-
90
-
91
-
92
-
93
-
94
-
95
-
96
-
97
-
98
-
99
-
100
-
101
-
102
-
103
-
104
-
105
-
106
-
107
-
108
-
109
-
110
-
111
-
112
-
113
-
114
-
115
-
116
-
117
-
118
-
119
-
120
-
121
-
122
-
123
-
124
-
125
-
126
-
127
-
128
-
129
-
130
-
131
-
132
-
133
-
134
-
135
-
136
-
137
-
138
-
139
-
140
-
141
-
142
-
143
-
144
-
145
-
146
-
147
-
148
-
149
-
150
-
151
-
152
-
153
-
154
-
155
-
156
-
157
-
158
-
159
-
160
-
161
-
162
-
163
-
164
-
165
-
166
-
167
-
168
-
169
-
170
-
171
-
172
-
173
-
174
-
175
-
176
-
177
-
178
-
179
-
180
-
181
-
182
-
183
-
184
-
185
-
186
-
187
-
188
-
189
-
190
-
191
-
192
-
193
-
194
-
195
-
196
-
197
-
198
-
199
-
200
-
201
-
202
-
203
-
204
-
205
-
206
-
207
-
208
-
209
-
210
-
211
-
212
-
213
-
214
-
215
-
216
-
217
-
218
-
219
-
220
-
221
-
222
-
223
-
224
-
225
-
226
-
227
-
228
-
229
-
230
-
231
-
232
-
233
-
234
-
235
-
236
-
237
-
238
-
239
-
240
-
241
-
242
-
243
-
244
 |
 |

Group performance 5.2.10
38 Annual Report 2014
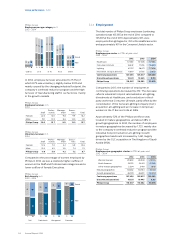
also cover supplier factories in the Yangtze River Delta
area. A total of 21 Philips suppliers are now participating
in the program.
5.2.11 Conict minerals: issues further down the
chain
In line with Philips’ commitment to supply-chain
sustainability, we are concerned about the situation in
eastern DRC (the Democratic Republic of the Congo),
where proceeds from the mining sector are used to
nance rebel conicts in the region. Philips does not
directly source minerals from the DRC and the mines
are typically seven or more tiers away from our direct
suppliers. Philips nevertheless feels obliged to address
this issue through the means and inuencing
mechanisms available to us.
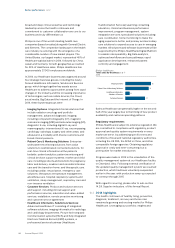
We were one of the rst companies to survey our
suppliers to identify smelters used in the supply chain
that produce the metals of concern, and one of the four
companies to have our SEC Conict Minerals report
audited in 2014. We are cooperating with industry to
drive the identied smelters to become compliant with
the Conict-Free Smelter Program or an equivalent
third-party audit program. We also realize how
important it is not to boycott the minerals from the DRC
and neighboring countries entirely. That is why we are
supporting veried conict-free supply chains that
contribute to economic development in the DRC region.
For more details and results of our supplier
sustainability program, please refer to sub-section
14.2.8, Supplier indicators, of this Annual Report.
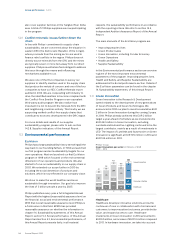
5.3 Environmental performance
EcoVision
Philips has a long sustainability history stretching all the
way back to our founding fathers. In 1994 we launched
our rst program and set sustainability targets for our
own operations. Next we launched our rst EcoVision
program in 1998 which focused on the environmental
dimension of our operations and products. We also
started to focus on sustainability in our supply chain in
2003. We extended our scope further in 2010 by
including the social dimension of products and
solutions, which is now reected in our company vision:
We strive to make the world healthier and more
sustainable through innovation. Our goal is to improve
the lives of 3 billion people a year by 2025.
Philips publishes every year a full Integrated Annual
Report with the highest (reasonable) assurance level on
the nancial, social and environmental performance.
With that overall reasonable assurance level Philips is
a frontrunner in this eld. KPMG has provided
reasonable assurance on whether the information in
chapter 14, Sustainability statements, of this Annual
Report, section 5.2, Social performance, of this Annual
Report and section 5.3, Environmental performance, of
this Annual Report presents fairly, in all material
respects, the sustainability performance in accordance
with the reporting criteria. We refer to section 14.4,
Independent Auditor’s Assurance Report, of this Annual
Report.
The main elements of the EcoVision program are:
▪Improving people’s lives
▪Green Product sales
▪Green Innovation, including Circular Economy
▪Green Operations
▪Health and Safety
▪Supplier Sustainability
In this Environmental performance section an overview
is given of the most important environmental
parameters of the program. Improving people’s lives,
Health and Safety, and Supplier Sustainability are
addressed in the Social performance section. Details of
the EcoVision parameters can be found in the chapter
14, Sustainability statements, of this Annual Report.
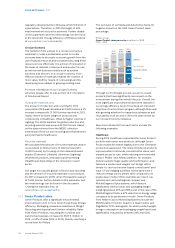
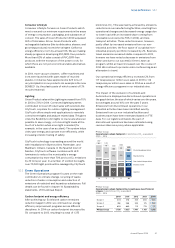
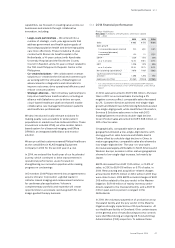
5.3.1 Green Innovation
Green Innovation is the Research & Development
spend related to the development of new generations
of Green Products and Green Technologies. We
announced in 2010 our plan to invest a cumulative EUR
2 billion in Green Innovation during the coming 5 years.
In 2014, Philips already achieved this EUR 2 billion
target a year ahead of schedule as we invested some
EUR 463 million in Green Innovation, excluding
Lumileds and Automotive. Lighting continued to be the
largest contributor, mainly as a result of investments in
LED. The impact of Lumileds and Automotive on Green
Innovation is signicant at EUR 105 million in 2014 and
EUR 104 million in 2013.
Philips Group
Green Innovation per sector in millions of EUR
2010 - 2014
60
56
151
46
313
‘10
85
67
175
36
363
‘11
136
70
209
38
453
‘12
80
75
223
27
405
‘13
90 Healthcare
97 Consumer Lifestyle
255 Lighting
21
Group Innovation
463
‘14
Healthcare
Healthcare develops innovative solutions across the
continuum of care in collaboration with clinicians and
customers, to improve patient outcomes, provide better
value, and expand access to care. Healthcare
investments in Green Innovation in 2014 amounted to
EUR 90 million, an increase of EUR 10 million compared
to 2013. In hardware innovation, we take into account