General Motors 2010 Annual Report Download - page 100
Download and view the complete annual report
Please find page 100 of the 2010 General Motors annual report below. You can navigate through the pages in the report by either clicking on the pages listed below, or by using the keyword search tool below to find specific information within the annual report.-
 1
1 -
2
-
3
-
4
-
5
-
6
-
7
-
8
-
9
-
10
-
11
-
12
-
13
-
14
-
15
-
16
-
17
-
18
-
19
-
20
-
21
-
22
-
23
-
24
-
25
-
26
-
27
-
28
-
29
-
30
-
31
-
32
-
33
-
34
-
35
-
36
-
37
-
38
-
39
-
40
-
41
-
42
-
43
-
44
-
45
-
46
-
47
-
48
-
49
-
50
-
51
-
52
-
53
-
54
-
55
-
56
-
57
-
58
-
59
-
60
-
61
-
62
-
63
-
64
-
65
-
66
-
67
-
68
-
69
-
70
-
71
-
72
-
73
-
74
-
75
-
76
-
77
-
78
-
79
-
80
-
81
-
82
-
83
-
84
-
85
-
86
-
87
-
88
-
89
-
 90
90 -
 91
91 -
 92
92 -
 93
93 -
 94
94 -
 95
95 -
 96
96 -
 97
97 -
 98
98 -
 99
99 -
 100
100 -
 101
101 -
 102
102 -
 103
103 -
 104
104 -
 105
105 -
 106
106 -
 107
107 -
 108
108 -
 109
109 -
 110
110 -
111
-
112
-
113
-
114
-
115
-
116
-
117
-
118
-
119
-
120
-
121
-
122
-
123
-
124
-
125
-
126
-
127
-
128
-
129
-
130
-
131
-
132
-
133
-
134
-
135
-
136
-
137
-
138
-
139
-
140
-
141
-
142
-
143
-
144
-
145
-
146
-
147
-
148
-
149
-
150
-
151
-
152
-
153
-
154
-
155
-
156
-
157
-
158
-
159
-
160
-
161
-
162
-
163
-
164
-
165
-
166
-
167
-
168
-
169
-
170
-
171
-
172
-
173
-
174
-
175
-
176
-
177
-
178
-
179
-
180
-
181
-
182
-
183
-
184
-
185
-
186
-
187
-
188
-
189
-
190
-
191
-
192
-
193
-
194
-
195
-
196
-
197
-
198
-
199
-
200
-
201
-
202
-
203
-
204
-
205
-
206
-
207
-
208
-
209
-
210
-
211
-
212
-
213
-
214
-
215
-
216
-
217
-
218
-
219
-
220
-
221
-
222
-
223
-
224
-
225
-
226
-
227
-
228
-
229
-
230
-
231
-
232
-
233
-
234
-
235
-
236
-
237
-
238
-
239
-
240
-
241
-
242
-
243
-
244
-
245
-
246
-
247
-
248
-
249
-
250
-
251
-
252
-
253
-
254
-
255
-
256
-
257
-
258
-
259
-
260
-
261
-
262
-
263
-
264
-
265
-
266
-
267
-
268
-
269
-
270
-
271
-
272
-
273
-
274
-
275
-
276
-
277
-
278
-
279
-
280
-
281
-
282
-
283
-
284
-
285
-
286
-
287
-
288
-
289
-
290
 |
 |

GENERAL MOTORS COMPANY AND SUBSIDIARIES
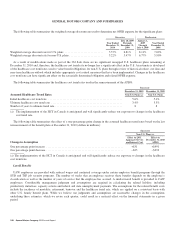
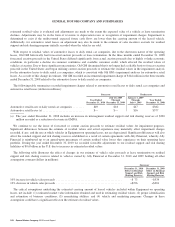
The following table illustrates the sensitivity to a change in certain assumptions for the pension plans, holding all other assumptions
constant (dollars in millions):
Successor
U.S. Plans Non-U.S. Plans
Effect on 2011
Pension
Expense
Effect on
December 31,
2010
PBO
Effect on 2011
Pension
Expense
Effect on
December 31,
2010
PBO
25 basis point decrease in discount rate .............................. –$110 +$2,540 –$ 7 +$714
25 basis point increase in discount rate .............................. +$ 90 –$2,470 +$10 –$677
25 basis point decrease in expected return on assets .................... +$210 — +$35 —
25 basis point increase in expected return on assets .................... –$210 — –$35 —
The U.S. pension plans generally provide covered U.S. hourly employees hired prior to October 15, 2007 with pension benefits of
negotiated, flat dollar amounts for each year of credited service earned by an individual employee. Early retirement supplements are
also provided to those who retire prior to age 62. Hourly employees hired after October 15, 2007 participate in a cash balance pension
plan. Formulas providing for such stated amounts are contained in the applicable labor contract. Pension expense and the pension
obligations do not consider any future benefit increases or decreases that may occur beyond current labor contracts. The usual cycle
for negotiating new labor contracts is every four years. We do not have a past practice of maintaining a consistent level of benefit
increases or decreases from one contract to the next.
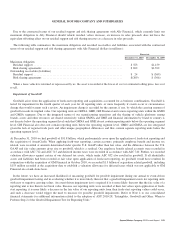
The following data illustrates the sensitivity of changes in pension expense and pension obligation based on the last remeasurement
of the U.S hourly pension plan at December 31, 2010, as a result of changes in future benefit units for U.S. hourly employees,
effective after the expiration of the current contract (dollars in millions):
Successor
Change in future benefit units
Effect on
2011
Pension Expense
Effect on
December 31, 2010
PBO
One percentage point increase in benefit units .......................................... +$81 +$240
One percentage point decrease in benefit units .......................................... –$79 –$233
We utilize a variety of pricing sources to estimate the fair value of our pension assets, including: independent pricing vendors,
dealer or counterparty supplied valuations, third party appraisals, appraisals prepared by investment managers, or investment sponsor
or third party administrator supplied net asset value (or its equivalent) per share (NAV) used as a practical expedient.
A significant portion of our pension assets are classified in Level 3. Pension assets for which fair value is determined through the
use of NAV and for which we may not have the ability to redeem our entire investment with the investee at NAV as of the
measurement date or in the near-term, are classified in Level 3. We classify pension assets that include significant unobservable inputs
in Level 3.
Significant assets classified in Level 3, with the related Level 3 inputs to the valuation that may be subject to volatility and change,
and additional considerations for leveling, are as follows:
• Government, agency and corporate debt securities — Pricing services and dealers often use proprietary pricing models which
incorporate unobservable inputs. These inputs primarily consist of yield and credit spread assumptions. Management may
consider other security attributes such as liquidity, market activity, price level, credit ratings and geo-political risk, in assessing
the observability of inputs used by pricing services or dealers, which may affect classification in the fair value hierarchy.
• Group annuity contracts – The value of each group annuity contract or policy depends, in part, on the values of the units of the
separately managed investment accounts backing the contract. The fair value of the separately managed investment account
98 General Motors Company 2010 Annual Report