General Motors 2010 Annual Report Download - page 142
Download and view the complete annual report
Please find page 142 of the 2010 General Motors annual report below. You can navigate through the pages in the report by either clicking on the pages listed below, or by using the keyword search tool below to find specific information within the annual report.-
 1
1 -
2
-
3
-
4
-
5
-
6
-
7
-
8
-
9
-
10
-
11
-
12
-
13
-
14
-
15
-
16
-
17
-
18
-
19
-
20
-
21
-
22
-
23
-
24
-
25
-
26
-
27
-
28
-
29
-
30
-
31
-
32
-
33
-
34
-
35
-
36
-
37
-
38
-
39
-
40
-
41
-
42
-
43
-
44
-
45
-
46
-
47
-
48
-
49
-
50
-
51
-
52
-
53
-
54
-
55
-
56
-
57
-
58
-
59
-
60
-
61
-
62
-
63
-
64
-
65
-
66
-
67
-
68
-
69
-
70
-
71
-
72
-
73
-
74
-
75
-
76
-
77
-
78
-
79
-
80
-
81
-
82
-
83
-
84
-
85
-
86
-
87
-
88
-
89
-
90
-
91
-
92
-
93
-
94
-
95
-
96
-
97
-
98
-
99
-
100
-
101
-
102
-
103
-
104
-
105
-
106
-
107
-
108
-
109
-
110
-
111
-
112
-
113
-
114
-
115
-
116
-
117
-
118
-
119
-
120
-
121
-
122
-
123
-
124
-
125
-
126
-
127
-
128
-
129
-
130
-
131
-
 132
132 -
 133
133 -
 134
134 -
 135
135 -
 136
136 -
 137
137 -
 138
138 -
 139
139 -
 140
140 -
 141
141 -
 142
142 -
 143
143 -
 144
144 -
 145
145 -
 146
146 -
 147
147 -
 148
148 -
 149
149 -
 150
150 -
 151
151 -
 152
152 -
153
-
154
-
155
-
156
-
157
-
158
-
159
-
160
-
161
-
162
-
163
-
164
-
165
-
166
-
167
-
168
-
169
-
170
-
171
-
172
-
173
-
174
-
175
-
176
-
177
-
178
-
179
-
180
-
181
-
182
-
183
-
184
-
185
-
186
-
187
-
188
-
189
-
190
-
191
-
192
-
193
-
194
-
195
-
196
-
197
-
198
-
199
-
200
-
201
-
202
-
203
-
204
-
205
-
206
-
207
-
208
-
209
-
210
-
211
-
212
-
213
-
214
-
215
-
216
-
217
-
218
-
219
-
220
-
221
-
222
-
223
-
224
-
225
-
226
-
227
-
228
-
229
-
230
-
231
-
232
-
233
-
234
-
235
-
236
-
237
-
238
-
239
-
240
-
241
-
242
-
243
-
244
-
245
-
246
-
247
-
248
-
249
-
250
-
251
-
252
-
253
-
254
-
255
-
256
-
257
-
258
-
259
-
260
-
261
-
262
-
263
-
264
-
265
-
266
-
267
-
268
-
269
-
270
-
271
-
272
-
273
-
274
-
275
-
276
-
277
-
278
-
279
-
280
-
281
-
282
-
283
-
284
-
285
-
286
-
287
-
288
-
289
-
290
 |
 |

GENERAL MOTORS COMPANY AND SUBSIDIARIES
NOTES TO CONSOLIDATED FINANCIAL STATEMENTS — (Continued)
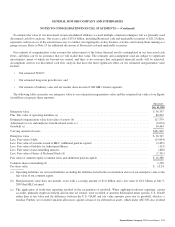
The following table summarizes the components of our intangible assets and their weighted-average amortization periods.
Weighted-Average
Amortization Period
(years) Recorded Value
Technology and related intellectual property ........................................... 5 $ 7,889
Brands ......................................................................... 38 5,476
Dealer network and customer relationships ............................................ 21 2,149
Favorable contracts ............................................................... 28 543
Other intangible assets ............................................................ 3 17
Total intangible assets ............................................................. $16,074
Deferred Income Taxes, Non-Current
We recorded Deferred income taxes, non-current of $672 million which was an increase of $43 million compared to that recorded
by Old GM.
Other Assets, Non-Current
We recorded Other assets, non-current of $3.2 billion. Other assets, non-current differed from Old GM’s primarily related to: (1) an
increase of $1.3 billion and $629 million in the value of our investments in Ally Financial common stock and preferred stock; (2) an
increase of $175 million in the value of our investment in Saab; partially offset by (3) an elimination of $191 million for certain
prepaid rent balances and other adjustments.
We calculated the fair value of our investment in Ally Financial common stock of $1.3 billion using a market multiple
sum-of-the-parts methodology, a market approach. This approach considered the average price/tangible book value multiples of
companies deemed comparable to each of Ally Financial’s Auto Finance, Commercial Finance and Insurance operations in
determining the fair value of each of these operations, which were then aggregated to determine Ally Financial’s overall fair value.
The significant inputs used in our fair value analysis were as follows:
• Ally Financial’s June 30, 2009 financial statements, as well as the financial statements of comparable companies in the Auto
Finance, Commercial Finance and Insurance industries;
• Expected performance of Ally Financial, as well as our view on its ability to access capital markets; and
• The value of Ally Financial’s mortgage operations, taking into consideration the continuing challenges in the housing markets
and mortgage industry, and its need for additional liquidity to maintain business operations.
We calculated the fair value of our investment in Ally Financial preferred stock of $665 million using a discounted cash flow
approach. The present value of the cash flows was determined using assumptions regarding the expected receipt of dividends on Ally
Financial preferred stock and the expected call date. The discount rate of 16.9% was determined based on yields of similar Ally
Financial securities.
Accounts Payable
We recorded Accounts payable at its fair value of $13.1 billion.
Debt
We recorded short-term debt, current portion of long-term debt and long-term debt at their total fair value of $15.7 billion, which
was calculated using a discounted cash flow methodology using our implied credit rating of CCC for most of our debt instruments
(our credit rating was not observable as a result of the Chapter 11 Proceedings), adjusted where appropriate for any security interests.
140 General Motors Company 2010 Annual Report