General Motors 2010 Annual Report Download - page 219
Download and view the complete annual report
Please find page 219 of the 2010 General Motors annual report below. You can navigate through the pages in the report by either clicking on the pages listed below, or by using the keyword search tool below to find specific information within the annual report.-
 1
1 -
2
-
3
-
4
-
5
-
6
-
7
-
8
-
9
-
10
-
11
-
12
-
13
-
14
-
15
-
16
-
17
-
18
-
19
-
20
-
21
-
22
-
23
-
24
-
25
-
26
-
27
-
28
-
29
-
30
-
31
-
32
-
33
-
34
-
35
-
36
-
37
-
38
-
39
-
40
-
41
-
42
-
43
-
44
-
45
-
46
-
47
-
48
-
49
-
50
-
51
-
52
-
53
-
54
-
55
-
56
-
57
-
58
-
59
-
60
-
61
-
62
-
63
-
64
-
65
-
66
-
67
-
68
-
69
-
70
-
71
-
72
-
73
-
74
-
75
-
76
-
77
-
78
-
79
-
80
-
81
-
82
-
83
-
84
-
85
-
86
-
87
-
88
-
89
-
90
-
91
-
92
-
93
-
94
-
95
-
96
-
97
-
98
-
99
-
100
-
101
-
102
-
103
-
104
-
105
-
106
-
107
-
108
-
109
-
110
-
111
-
112
-
113
-
114
-
115
-
116
-
117
-
118
-
119
-
120
-
121
-
122
-
123
-
124
-
125
-
126
-
127
-
128
-
129
-
130
-
131
-
132
-
133
-
134
-
135
-
136
-
137
-
138
-
139
-
140
-
141
-
142
-
143
-
144
-
145
-
146
-
147
-
148
-
149
-
150
-
151
-
152
-
153
-
154
-
155
-
156
-
157
-
158
-
159
-
160
-
161
-
162
-
163
-
164
-
165
-
166
-
167
-
168
-
169
-
170
-
171
-
172
-
173
-
174
-
175
-
176
-
177
-
178
-
179
-
180
-
181
-
182
-
183
-
184
-
185
-
186
-
187
-
188
-
189
-
190
-
191
-
192
-
193
-
194
-
195
-
196
-
197
-
198
-
199
-
200
-
201
-
202
-
203
-
204
-
205
-
206
-
207
-
208
-
 209
209 -
 210
210 -
 211
211 -
 212
212 -
 213
213 -
 214
214 -
 215
215 -
 216
216 -
 217
217 -
 218
218 -
 219
219 -
 220
220 -
 221
221 -
 222
222 -
 223
223 -
 224
224 -
 225
225 -
 226
226 -
 227
227 -
 228
228 -
 229
229 -
230
-
231
-
232
-
233
-
234
-
235
-
236
-
237
-
238
-
239
-
240
-
241
-
242
-
243
-
244
-
245
-
246
-
247
-
248
-
249
-
250
-
251
-
252
-
253
-
254
-
255
-
256
-
257
-
258
-
259
-
260
-
261
-
262
-
263
-
264
-
265
-
266
-
267
-
268
-
269
-
270
-
271
-
272
-
273
-
274
-
275
-
276
-
277
-
278
-
279
-
280
-
281
-
282
-
283
-
284
-
285
-
286
-
287
-
288
-
289
-
290
 |
 |

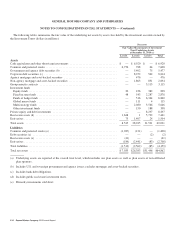
GENERAL MOTORS COMPANY AND SUBSIDIARIES
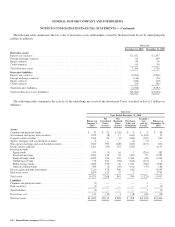
NOTES TO CONSOLIDATED FINANCIAL STATEMENTS — (Continued)
Successor
July 10, 2009 Through December 31, 2009
Balance at
July 10,
2009
Net
Unrealized
Gains
(Losses)
Net
Realized
Gains
(Losses)
Purchases,
Sales and
Settlements
Transfers
into
(out of)
Level 3
Balance at
December 31,
2009
Assets
Common and preferred stocks .......................................... $ 17 $ 12 $ (6) $ 35 $ (5) $ 53
Government and agency debt securities .................................. 29 140 28 66 1,289 1,552
Corporate debt securities .............................................. 749 173 (6) 615 233 1,764
Agency mortgage and asset-backed securities ............................. 3 5 (3) 3 (2) 6
Non-agency mortgage and asset-backed securities .......................... 544 455 (162) 393 295 1,525
Group annuity contracts .............................................. 3,393 (33) 74 (133) — 3,301
Investment funds
Equity funds ..................................................... 538 87 (7) (20) (22) 576
Fixed income funds ................................................ 2,179 736 (397) 32 (283) 2,267
Funds of hedge funds .............................................. 3,480 321 1 653 — 4,455
Global macro funds ................................................ 864 157 (5) (31) (266) 719
Multi-strategy funds ............................................... 1,100 49 112 719 (151) 1,829
Other investment funds ............................................. 318 16 1 124 — 459
Private equity and debt investments ..................................... 6,618 264 205 123 — 7,210
Real estate assets .................................................... 5,701 (1,086) 364 230 — 5,209
Total assets ........................................................ 25,533 1,296 199 2,809 1,088 30,925
Liabilities
Common and preferred stocks .......................................... (4) (1) — 2 1 (2)
Debt securities ...................................................... — — — (3) — (3)
Total liabilities ...................................................... (4) (1) — (1) 1 (5)
Derivatives, net ..................................................... (314) (8) (22) 66 390 112
Total net assets ..................................................... $25,215 $ 1,287 $ 177 $2,874 $1,479 $31,032
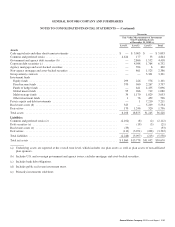
Predecessor
January 1, 2009 Through July 9, 2009
Balance at
January 1,
2009
Net
Unrealized
Gains
(Losses)
Net
Realized
Gains
(Losses)
Purchases,
Sales and
Settlements
Transfers
into
(out of)
Level 3
Balance at
July 9, 2009
Assets
Common and preferred stocks .......................................... $ 11 $ (2) $ 2 $ 6 $ — $ 17
Government and agency debt securities .................................. 9 3 — 17 — 29
Corporate debt securities .............................................. 604 172 (47) 15 5 749
Agency mortgage and asset-backed securities ............................. 5 — — (1) (1) 3
Non-agency mortgage and asset-backed securities .......................... 717 (147) (16) 9 (19) 544
Group annuity contracts .............................................. 3,316 (57) 83 51 — 3,393
Investment funds
Equity funds ..................................................... 456 18 — 64 — 538
Fixed income funds ................................................ 1,427 498 — 254 — 2,179
Funds of hedge funds .............................................. 3,106 27 — 347 — 3,480
Global macro funds ................................................ 1,351 (20) 82 (549) — 864
Multi-strategy funds ............................................... 1,486 24 6 (416) — 1,100
Other investment funds ............................................. 701 (73) (19) (281) (10) 318
Private equity and debt investments ..................................... 7,564 (1,049) (64) 167 — 6,618
Real estate assets .................................................... 7,899 (2,440) (10) 252 — 5,701
Total assets ........................................................ 28,652 (3,046) 17 (65) (25) 25,533
Liabilities
Common and preferred stocks .......................................... (1) 1 1 (5) — (4)
Total liabilities ...................................................... (1) 1 1 (5) (4)
Derivatives, net ..................................................... 1,420 (1,469) (229) (36) — (314)
Total net assets (liabilities) ............................................ $30,071 $(4,514) $(211) $ (106) $ (25) $25,215
General Motors Company 2010 Annual Report 217