General Motors 2010 Annual Report Download - page 250
Download and view the complete annual report
Please find page 250 of the 2010 General Motors annual report below. You can navigate through the pages in the report by either clicking on the pages listed below, or by using the keyword search tool below to find specific information within the annual report.-
 1
1 -
2
-
3
-
4
-
5
-
6
-
7
-
8
-
9
-
10
-
11
-
12
-
13
-
14
-
15
-
16
-
17
-
18
-
19
-
20
-
21
-
22
-
23
-
24
-
25
-
26
-
27
-
28
-
29
-
30
-
31
-
32
-
33
-
34
-
35
-
36
-
37
-
38
-
39
-
40
-
41
-
42
-
43
-
44
-
45
-
46
-
47
-
48
-
49
-
50
-
51
-
52
-
53
-
54
-
55
-
56
-
57
-
58
-
59
-
60
-
61
-
62
-
63
-
64
-
65
-
66
-
67
-
68
-
69
-
70
-
71
-
72
-
73
-
74
-
75
-
76
-
77
-
78
-
79
-
80
-
81
-
82
-
83
-
84
-
85
-
86
-
87
-
88
-
89
-
90
-
91
-
92
-
93
-
94
-
95
-
96
-
97
-
98
-
99
-
100
-
101
-
102
-
103
-
104
-
105
-
106
-
107
-
108
-
109
-
110
-
111
-
112
-
113
-
114
-
115
-
116
-
117
-
118
-
119
-
120
-
121
-
122
-
123
-
124
-
125
-
126
-
127
-
128
-
129
-
130
-
131
-
132
-
133
-
134
-
135
-
136
-
137
-
138
-
139
-
140
-
141
-
142
-
143
-
144
-
145
-
146
-
147
-
148
-
149
-
150
-
151
-
152
-
153
-
154
-
155
-
156
-
157
-
158
-
159
-
160
-
161
-
162
-
163
-
164
-
165
-
166
-
167
-
168
-
169
-
170
-
171
-
172
-
173
-
174
-
175
-
176
-
177
-
178
-
179
-
180
-
181
-
182
-
183
-
184
-
185
-
186
-
187
-
188
-
189
-
190
-
191
-
192
-
193
-
194
-
195
-
196
-
197
-
198
-
199
-
200
-
201
-
202
-
203
-
204
-
205
-
206
-
207
-
208
-
209
-
210
-
211
-
212
-
213
-
214
-
215
-
216
-
217
-
218
-
219
-
220
-
221
-
222
-
223
-
224
-
225
-
226
-
227
-
228
-
229
-
230
-
231
-
232
-
233
-
234
-
235
-
236
-
237
-
238
-
239
-
 240
240 -
 241
241 -
 242
242 -
 243
243 -
 244
244 -
 245
245 -
 246
246 -
 247
247 -
 248
248 -
 249
249 -
 250
250 -
 251
251 -
 252
252 -
 253
253 -
 254
254 -
 255
255 -
 256
256 -
 257
257 -
 258
258 -
 259
259 -
 260
260 -
261
-
262
-
263
-
264
-
265
-
266
-
267
-
268
-
269
-
270
-
271
-
272
-
273
-
274
-
275
-
276
-
277
-
278
-
279
-
280
-
281
-
282
-
283
-
284
-
285
-
286
-
287
-
288
-
289
-
290
 |
 |

GENERAL MOTORS COMPANY AND SUBSIDIARIES
NOTES TO CONSOLIDATED FINANCIAL STATEMENTS — (Continued)
• Expected performance of Ally Financial, as well as our view on its ability to access capital markets; and
• The value of Ally Financial’s mortgage operations, taking into consideration the continuing challenges in the housing markets
and mortgage industry, and its need for additional liquidity to maintain business operations.
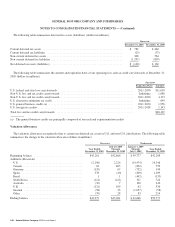
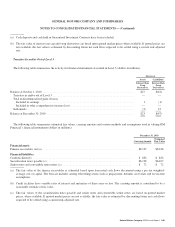
At December 31, 2010 and 2009 we calculated the fair value of our investment in Ally Financial’s preferred stock using a
discounted cash flow approach. The present value of the cash flows was determined using assumptions regarding the expected receipt
of dividends on Ally Financial’s preferred stock and the expected call date.
The following table summarizes the carrying amount and estimated fair value of Ally Financial common and preferred stock
(dollars in millions):
Successor
December 31, 2010 December 31, 2009
Common stock
Carrying amount (a) ............................................................. $ 964 $970
Fair value ...................................................................... $1,031 $970
Preferred stock
Carrying amount ................................................................ $ 665 $665
Fair value ...................................................................... $1,055 $989
(a) Investment in Ally Financial common stock at December 31, 2010 and 2009 includes the 9.9% and 16.6% held directly and
indirectly through an independent trust.
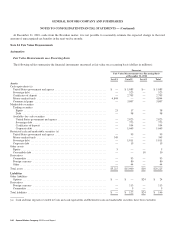
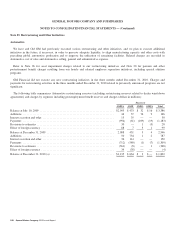
Automotive Financing
Fair Value Measurements on a Recurring Basis
The following table summarizes the financial instruments measured at fair value on a recurring basis (dollars in millions):
Successor
Fair Value Measurements on a Recurring Basis
at December 31, 2010
Level 1 Level 2 Level 3 Total
Assets
Cash equivalents (a)
Money market funds .................................................. $ 167 $— $— $ 167
Restricted cash (a)
Money market funds .................................................. 952 — — 952
Derivatives
Interest rate swaps (b) ................................................ — — 23 23
Interest rate caps (b) .................................................. — 8 — 8
Total assets ........................................................... $1,119 $ 8 $23 $1,150
Liabilities
Derivatives
Interest rate swaps (b) ................................................ $ — $— $47 $ 47
Interest rate caps (b) .................................................. — 8 — 8
Foreign currency contracts ............................................. — 2 — 2
Total liabilities ........................................................ $ $10 $47 $ 57
248 General Motors Company 2010 Annual Report