General Motors 2010 Annual Report Download - page 69
Download and view the complete annual report
Please find page 69 of the 2010 General Motors annual report below. You can navigate through the pages in the report by either clicking on the pages listed below, or by using the keyword search tool below to find specific information within the annual report.-
 1
1 -
2
-
3
-
4
-
5
-
6
-
7
-
8
-
9
-
10
-
11
-
12
-
13
-
14
-
15
-
16
-
17
-
18
-
19
-
20
-
21
-
22
-
23
-
24
-
25
-
26
-
27
-
28
-
29
-
30
-
31
-
32
-
33
-
34
-
35
-
36
-
37
-
38
-
39
-
40
-
41
-
42
-
43
-
44
-
45
-
46
-
47
-
48
-
49
-
50
-
51
-
52
-
53
-
54
-
55
-
56
-
57
-
58
-
 59
59 -
 60
60 -
 61
61 -
 62
62 -
 63
63 -
 64
64 -
 65
65 -
 66
66 -
 67
67 -
 68
68 -
 69
69 -
 70
70 -
 71
71 -
 72
72 -
 73
73 -
 74
74 -
 75
75 -
 76
76 -
 77
77 -
 78
78 -
 79
79 -
80
-
81
-
82
-
83
-
84
-
85
-
86
-
87
-
88
-
89
-
90
-
91
-
92
-
93
-
94
-
95
-
96
-
97
-
98
-
99
-
100
-
101
-
102
-
103
-
104
-
105
-
106
-
107
-
108
-
109
-
110
-
111
-
112
-
113
-
114
-
115
-
116
-
117
-
118
-
119
-
120
-
121
-
122
-
123
-
124
-
125
-
126
-
127
-
128
-
129
-
130
-
131
-
132
-
133
-
134
-
135
-
136
-
137
-
138
-
139
-
140
-
141
-
142
-
143
-
144
-
145
-
146
-
147
-
148
-
149
-
150
-
151
-
152
-
153
-
154
-
155
-
156
-
157
-
158
-
159
-
160
-
161
-
162
-
163
-
164
-
165
-
166
-
167
-
168
-
169
-
170
-
171
-
172
-
173
-
174
-
175
-
176
-
177
-
178
-
179
-
180
-
181
-
182
-
183
-
184
-
185
-
186
-
187
-
188
-
189
-
190
-
191
-
192
-
193
-
194
-
195
-
196
-
197
-
198
-
199
-
200
-
201
-
202
-
203
-
204
-
205
-
206
-
207
-
208
-
209
-
210
-
211
-
212
-
213
-
214
-
215
-
216
-
217
-
218
-
219
-
220
-
221
-
222
-
223
-
224
-
225
-
226
-
227
-
228
-
229
-
230
-
231
-
232
-
233
-
234
-
235
-
236
-
237
-
238
-
239
-
240
-
241
-
242
-
243
-
244
-
245
-
246
-
247
-
248
-
249
-
250
-
251
-
252
-
253
-
254
-
255
-
256
-
257
-
258
-
259
-
260
-
261
-
262
-
263
-
264
-
265
-
266
-
267
-
268
-
269
-
270
-
271
-
272
-
273
-
274
-
275
-
276
-
277
-
278
-
279
-
280
-
281
-
282
-
283
-
284
-
285
-
286
-
287
-
288
-
289
-
290
 |
 |

GENERAL MOTORS COMPANY AND SUBSIDIARIES
inventory considered the estimated selling price of the inventory less the costs a market participant would incur to complete, sell and
dispose of the inventory, which may be different than our costs, and the profit margin required for its completion and disposal effort;
partially offset by (3) administrative expenses of $0.5 billion; (4) advertising and sales promotion expenses of $0.3 billion primarily to
support media campaigns for our products; (5) selling and marketing expenses of $0.1 billion; and (6) unfavorable amortization of
$0.1 billion related to intangible assets.
Old GM
In the period January 1, 2009 through July 9, 2009 EBIT was a loss of $0.5 billion and included: (1) derivative losses of $0.8 billion
at GM Daewoo; (2) administrative expenses of $0.4 billion; (3) advertising and sales promotion expenses of $0.2 billion primarily to
support media campaigns for our products; partially offset by (4) Equity income, net of tax, of $0.3 billion primarily from the
operating results of our China JVs; and (5) favorable effect of $0.1 billion related to the net loss attributable to minority shareholders
of GM Daewoo.
In the year ended December 31, 2008 EBIT was a loss of $0.6 billion and included: (1) derivative losses of $1.7 billion at GM
Daewoo; (2) administrative expenses of $0.9 billion; (3) advertising and sales promotion expenses of $0.8 billion primarily to support
media campaigns for our products; partially offset by (4) Equity income, net of tax, of $0.4 billion primarily from the operating results
of our China JVs; (5) selling and marketing expenses of $0.2 billion; and (6) favorable effect of $0.1 billion related to the net loss
attributable to minority shareholders of GM Daewoo.
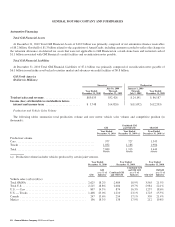
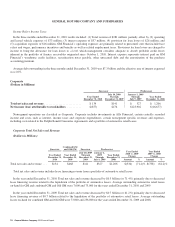
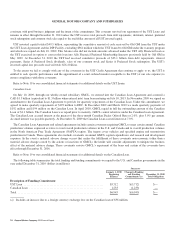
GM South America
(Dollars in Millions)
Successor Predecessor
Year Ended
December 31, 2010
July 10, 2009
Through
December 31, 2009
January 1, 2009
Through
July 9, 2009
Year Ended
December 31, 2008
Total net sales and revenue .......................... $15,379 $7,399 $5,736 $14,522
Income (loss) attributable to stockholders before interest
and income taxes ................................ $ 818 $ 417 $ (454) $ 1,076
Production and Vehicle Sales Volume
The following tables summarize total production volume and new motor vehicle sales volume and competitive position (in
thousands):
GM
Combined GM
and Old GM Old GM
Year Ended
December 31, 2010
Year Ended
December 31, 2009
Year Ended
December 31, 2008
Production volume ............................................... 926 807 865
General Motors Company 2010 Annual Report 67