General Motors 2010 Annual Report Download - page 167
Download and view the complete annual report
Please find page 167 of the 2010 General Motors annual report below. You can navigate through the pages in the report by either clicking on the pages listed below, or by using the keyword search tool below to find specific information within the annual report.-
 1
1 -
2
-
3
-
4
-
5
-
6
-
7
-
8
-
9
-
10
-
11
-
12
-
13
-
14
-
15
-
16
-
17
-
18
-
19
-
20
-
21
-
22
-
23
-
24
-
25
-
26
-
27
-
28
-
29
-
30
-
31
-
32
-
33
-
34
-
35
-
36
-
37
-
38
-
39
-
40
-
41
-
42
-
43
-
44
-
45
-
46
-
47
-
48
-
49
-
50
-
51
-
52
-
53
-
54
-
55
-
56
-
57
-
58
-
59
-
60
-
61
-
62
-
63
-
64
-
65
-
66
-
67
-
68
-
69
-
70
-
71
-
72
-
73
-
74
-
75
-
76
-
77
-
78
-
79
-
80
-
81
-
82
-
83
-
84
-
85
-
86
-
87
-
88
-
89
-
90
-
91
-
92
-
93
-
94
-
95
-
96
-
97
-
98
-
99
-
100
-
101
-
102
-
103
-
104
-
105
-
106
-
107
-
108
-
109
-
110
-
111
-
112
-
113
-
114
-
115
-
116
-
117
-
118
-
119
-
120
-
121
-
122
-
123
-
124
-
125
-
126
-
127
-
128
-
129
-
130
-
131
-
132
-
133
-
134
-
135
-
136
-
137
-
138
-
139
-
140
-
141
-
142
-
143
-
144
-
145
-
146
-
147
-
148
-
149
-
150
-
151
-
152
-
153
-
154
-
155
-
156
-
 157
157 -
 158
158 -
 159
159 -
 160
160 -
 161
161 -
 162
162 -
 163
163 -
 164
164 -
 165
165 -
 166
166 -
 167
167 -
 168
168 -
 169
169 -
 170
170 -
 171
171 -
 172
172 -
 173
173 -
 174
174 -
 175
175 -
 176
176 -
 177
177 -
178
-
179
-
180
-
181
-
182
-
183
-
184
-
185
-
186
-
187
-
188
-
189
-
190
-
191
-
192
-
193
-
194
-
195
-
196
-
197
-
198
-
199
-
200
-
201
-
202
-
203
-
204
-
205
-
206
-
207
-
208
-
209
-
210
-
211
-
212
-
213
-
214
-
215
-
216
-
217
-
218
-
219
-
220
-
221
-
222
-
223
-
224
-
225
-
226
-
227
-
228
-
229
-
230
-
231
-
232
-
233
-
234
-
235
-
236
-
237
-
238
-
239
-
240
-
241
-
242
-
243
-
244
-
245
-
246
-
247
-
248
-
249
-
250
-
251
-
252
-
253
-
254
-
255
-
256
-
257
-
258
-
259
-
260
-
261
-
262
-
263
-
264
-
265
-
266
-
267
-
268
-
269
-
270
-
271
-
272
-
273
-
274
-
275
-
276
-
277
-
278
-
279
-
280
-
281
-
282
-
283
-
284
-
285
-
286
-
287
-
288
-
289
-
290
 |
 |

GENERAL MOTORS COMPANY AND SUBSIDIARIES
NOTES TO CONSOLIDATED FINANCIAL STATEMENTS — (Continued)
Nexteer and the four domestic facilities had revenue of $3.7 billion in the year ended December 31, 2008 of which 68% was related
to sales to Old GM. Furthermore, through the terms of the MRA, we provided Delphi labor cost subsidies and production cash burn
support to many of the facilities acquired. Refer to Note 22 for additional information on the MRA. Since we and Old GM accounted
for a significant portion of Nexteer’s and the four domestic facilities’ sales and because we were providing subsidies to Delphi related
to these facilities, the acquisition of these businesses did not have a significant effect on our consolidated financial results as the costs
associated with these facilities have been recorded as inventory costs and recorded in Automotive cost of sales. We did not provide
pro forma financial information because we do not believe this information would be material given the intercompany nature of
Nexteer and the four domestic facilities sales activity.
Saab Bankruptcy and Sale
In February 2009 Saab, part of our GME segment, filed for protection under the reorganization laws of Sweden in order to
reorganize itself into a stand-alone entity. Old GM determined that the reorganization proceeding resulted in a loss of the elements of
control necessary for consolidation and therefore Old GM deconsolidated Saab in February 2009. Old GM recorded a loss of $824
million in Other automotive expenses, net related to the deconsolidation. The loss reflected the remeasurement of Old GM’s net
investment in Saab to its estimated fair value of $0, costs associated with commitments and obligations to suppliers and others, and a
commitment to provide up to $150 million of DIP financing. We acquired Old GM’s investment in Saab in connection with the 363
Sale. In August 2009 Saab exited its reorganization proceeding, and we regained the elements of control and consolidated Saab at an
insignificant fair value.
Saab’s assets and liabilities were classified as held for sale at December 31, 2009. Saab’s total assets of $388 million included cash
and cash equivalents, inventory and receivables, and its total liabilities of $355 million included accounts payable, warranty and
pension obligations and other liabilities.
In February 2010 we completed the sale of Saab and in May 2010 we completed the sale of Saab Automobile GB (Saab GB) to
Spyker Cars NV. Of the negotiated cash purchase price of $74 million, we received $50 million at closing and received the remaining
$24 million in July 2010. We also received preference shares in Saab with a face value of $326 million and an estimated fair value
that is insignificant and received $114 million as repayment of the DIP financing that we provided to Saab during 2009. In the year
ended December 31, 2010 we recorded a gain of $123 million in Interest income and other non-operating income, net reflecting cash
received of $166 million less net assets with a book value of $43 million.
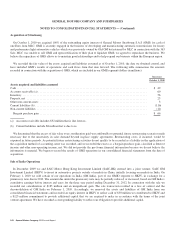
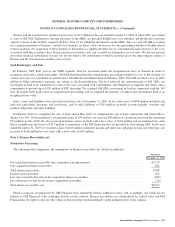
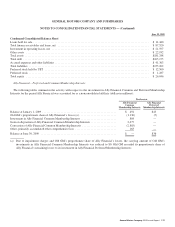
Note 6. Finance Receivables, net
Automotive Financing
The following table summarizes the components of Finance receivables, net (dollars in millions):
Successor
December 31, 2010
Pre-acquisition finance receivables (pre-acquisition carrying amount) ..................................... $7,724
Post-acquisition finance receivables ................................................................ 924
Total finance receivables ........................................................................ 8,648
Purchase price premium ......................................................................... 423
Less non-accretable discount on pre-acquisition finance receivables ...................................... (848)
Less allowance for loan losses on post-acquisition receivables ........................................... (26)
Total finance receivables, net ..................................................................... $8,197
Finance contracts are purchased by GM Financial from automobile dealers without recourse, and accordingly, the dealer has no
liability to GM Financial if the consumer defaults on the contract. Finance receivables are collateralized by vehicle titles and GM
Financial has the right to repossess the vehicle in the event the consumer defaults on the payment terms of the contract.
General Motors Company 2010 Annual Report 165