General Motors 2010 Annual Report Download - page 171
Download and view the complete annual report
Please find page 171 of the 2010 General Motors annual report below. You can navigate through the pages in the report by either clicking on the pages listed below, or by using the keyword search tool below to find specific information within the annual report.-
 1
1 -
2
-
3
-
4
-
5
-
6
-
7
-
8
-
9
-
10
-
11
-
12
-
13
-
14
-
15
-
16
-
17
-
18
-
19
-
20
-
21
-
22
-
23
-
24
-
25
-
26
-
27
-
28
-
29
-
30
-
31
-
32
-
33
-
34
-
35
-
36
-
37
-
38
-
39
-
40
-
41
-
42
-
43
-
44
-
45
-
46
-
47
-
48
-
49
-
50
-
51
-
52
-
53
-
54
-
55
-
56
-
57
-
58
-
59
-
60
-
61
-
62
-
63
-
64
-
65
-
66
-
67
-
68
-
69
-
70
-
71
-
72
-
73
-
74
-
75
-
76
-
77
-
78
-
79
-
80
-
81
-
82
-
83
-
84
-
85
-
86
-
87
-
88
-
89
-
90
-
91
-
92
-
93
-
94
-
95
-
96
-
97
-
98
-
99
-
100
-
101
-
102
-
103
-
104
-
105
-
106
-
107
-
108
-
109
-
110
-
111
-
112
-
113
-
114
-
115
-
116
-
117
-
118
-
119
-
120
-
121
-
122
-
123
-
124
-
125
-
126
-
127
-
128
-
129
-
130
-
131
-
132
-
133
-
134
-
135
-
136
-
137
-
138
-
139
-
140
-
141
-
142
-
143
-
144
-
145
-
146
-
147
-
148
-
149
-
150
-
151
-
152
-
153
-
154
-
155
-
156
-
157
-
158
-
159
-
160
-
 161
161 -
 162
162 -
 163
163 -
 164
164 -
 165
165 -
 166
166 -
 167
167 -
 168
168 -
 169
169 -
 170
170 -
 171
171 -
 172
172 -
 173
173 -
 174
174 -
 175
175 -
 176
176 -
 177
177 -
 178
178 -
 179
179 -
 180
180 -
 181
181 -
182
-
183
-
184
-
185
-
186
-
187
-
188
-
189
-
190
-
191
-
192
-
193
-
194
-
195
-
196
-
197
-
198
-
199
-
200
-
201
-
202
-
203
-
204
-
205
-
206
-
207
-
208
-
209
-
210
-
211
-
212
-
213
-
214
-
215
-
216
-
217
-
218
-
219
-
220
-
221
-
222
-
223
-
224
-
225
-
226
-
227
-
228
-
229
-
230
-
231
-
232
-
233
-
234
-
235
-
236
-
237
-
238
-
239
-
240
-
241
-
242
-
243
-
244
-
245
-
246
-
247
-
248
-
249
-
250
-
251
-
252
-
253
-
254
-
255
-
256
-
257
-
258
-
259
-
260
-
261
-
262
-
263
-
264
-
265
-
266
-
267
-
268
-
269
-
270
-
271
-
272
-
273
-
274
-
275
-
276
-
277
-
278
-
279
-
280
-
281
-
282
-
283
-
284
-
285
-
286
-
287
-
288
-
289
-
290
 |
 |

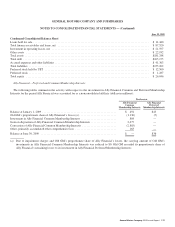
GENERAL MOTORS COMPANY AND SUBSIDIARIES
NOTES TO CONSOLIDATED FINANCIAL STATEMENTS — (Continued)
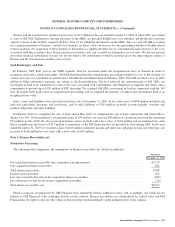
The following table summarizes the fair value of investments classified as available-for-sale securities by contractual maturity at
December 31, 2010 (dollars in millions):
Successor
Amortized
Cost Fair Value
Due in one year or less ...................................................................... $5,059 $5,059
Due after one year through five years ........................................................... 361 360
Total contractual maturities of available-for-sale securities .......................................... $5,420 $5,419
Refer to Note 26 for the amounts recorded as other than temporary impairments on debt and equity securities.
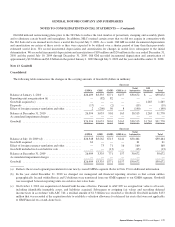
Note 9. Inventories
Automotive
The following table summarizes the components of Inventories (dollars in millions):
Successor
December 31, 2010 December 31, 2009
Productive material, supplies and work in process ...................................... $ 5,487 $ 4,201
Finished product, including service parts ............................................. 6,638 5,906
Total inventories ................................................................ $12,125 $10,107
In the period January 1, 2009 through July 9, 2009 and in the year ended December 31, 2008 Old GM’s U.S. LIFO eligible
inventory quantities were reduced. These reductions resulted in liquidations of LIFO inventory quantities, which were carried at lower
costs prevailing in prior years as compared with the costs of purchases in the period January 1, 2009 through July 9, 2009 and in the
year ended December 31, 2008. These liquidations decreased Old GM’s Automotive cost of sales by $5 million in the period
January 1, 2009 through July 9, 2009 and $355 million in the year ended December 31, 2008.
Note 10. Equipment on Operating Leases, net
Automotive
Equipment on operating leases, net is comprised of vehicle sales to daily rental car companies and to retail customers.
The following table summarizes information related to Equipment on operating leases, net and the related accumulated depreciation
(dollars in millions):
Successor
December 31, 2010 December 31, 2009
Equipment on operating leases ..................................................... $2,843 $3,070
Less accumulated depreciation ..................................................... (275) (343)
Equipment on operating leases, net .................................................. $2,568 $2,727
General Motors Company 2010 Annual Report 169