General Motors 2010 Annual Report Download - page 121
Download and view the complete annual report
Please find page 121 of the 2010 General Motors annual report below. You can navigate through the pages in the report by either clicking on the pages listed below, or by using the keyword search tool below to find specific information within the annual report.-
 1
1 -
2
-
3
-
4
-
5
-
6
-
7
-
8
-
9
-
10
-
11
-
12
-
13
-
14
-
15
-
16
-
17
-
18
-
19
-
20
-
21
-
22
-
23
-
24
-
25
-
26
-
27
-
28
-
29
-
30
-
31
-
32
-
33
-
34
-
35
-
36
-
37
-
38
-
39
-
40
-
41
-
42
-
43
-
44
-
45
-
46
-
47
-
48
-
49
-
50
-
51
-
52
-
53
-
54
-
55
-
56
-
57
-
58
-
59
-
60
-
61
-
62
-
63
-
64
-
65
-
66
-
67
-
68
-
69
-
70
-
71
-
72
-
73
-
74
-
75
-
76
-
77
-
78
-
79
-
80
-
81
-
82
-
83
-
84
-
85
-
86
-
87
-
88
-
89
-
90
-
91
-
92
-
93
-
94
-
95
-
96
-
97
-
98
-
99
-
100
-
101
-
102
-
103
-
104
-
105
-
106
-
107
-
108
-
109
-
110
-
 111
111 -
 112
112 -
 113
113 -
 114
114 -
 115
115 -
 116
116 -
 117
117 -
 118
118 -
 119
119 -
 120
120 -
 121
121 -
 122
122 -
 123
123 -
 124
124 -
 125
125 -
 126
126 -
 127
127 -
 128
128 -
 129
129 -
 130
130 -
 131
131 -
132
-
133
-
134
-
135
-
136
-
137
-
138
-
139
-
140
-
141
-
142
-
143
-
144
-
145
-
146
-
147
-
148
-
149
-
150
-
151
-
152
-
153
-
154
-
155
-
156
-
157
-
158
-
159
-
160
-
161
-
162
-
163
-
164
-
165
-
166
-
167
-
168
-
169
-
170
-
171
-
172
-
173
-
174
-
175
-
176
-
177
-
178
-
179
-
180
-
181
-
182
-
183
-
184
-
185
-
186
-
187
-
188
-
189
-
190
-
191
-
192
-
193
-
194
-
195
-
196
-
197
-
198
-
199
-
200
-
201
-
202
-
203
-
204
-
205
-
206
-
207
-
208
-
209
-
210
-
211
-
212
-
213
-
214
-
215
-
216
-
217
-
218
-
219
-
220
-
221
-
222
-
223
-
224
-
225
-
226
-
227
-
228
-
229
-
230
-
231
-
232
-
233
-
234
-
235
-
236
-
237
-
238
-
239
-
240
-
241
-
242
-
243
-
244
-
245
-
246
-
247
-
248
-
249
-
250
-
251
-
252
-
253
-
254
-
255
-
256
-
257
-
258
-
259
-
260
-
261
-
262
-
263
-
264
-
265
-
266
-
267
-
268
-
269
-
270
-
271
-
272
-
273
-
274
-
275
-
276
-
277
-
278
-
279
-
280
-
281
-
282
-
283
-
284
-
285
-
286
-
287
-
288
-
289
-
290
 |
 |

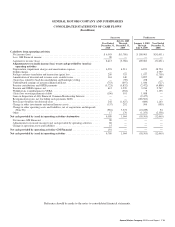
GENERAL MOTORS COMPANY AND SUBSIDIARIES
CONSOLIDATED STATEMENTS OF CASH FLOWS
(In millions)
Successor Predecessor
Year Ended
December 31,
2010
July 10, 2009
Through
December 31,
2009
January 1, 2009
Through
July 9, 2009
Year Ended
December 31,
2008
Cash flows from operating activities
Net income (loss) ..................................................... $6,503 $(3,786) $ 109,003 $(31,051)
Less: GM Financial income ............................................ 90 — — —
Automotive income (loss) .............................................. 6,413 (3,786) 109,003 (31,051)
Adjustments to reconcile income (loss) to net cash provided by (used in)
operating activities
Depreciation, impairment charges and amortization expense ................... 6,923 4,511 6,873 18,724
Delphi charges ....................................................... — — — 4,797
Foreign currency translation and transaction (gain) loss ....................... 209 755 1,077 (1,705)
Amortization of discount and issuance costs on debt issues .................... 163 140 3,897 189
(Gain) loss related to Saab deconsolidation and bankruptcy filing ............... — (59) 478 —
Undistributed earnings of nonconsolidated affiliates ......................... (753) (497) 1,036 (727)
Pension contributions and OPEB payments ................................ (5,723) (5,832) (2,472) (4,898)
Pension and OPEB expense, net ......................................... 412 3,570 3,234 2,747
Withdrawals (contributions) to VEBA .................................... — (252) 9 1,355
(Gain) loss on extinguishment of debt .................................... (196) 101 1,088 —
Gain on disposition of Ally Financial Common Membership Interests ........... — — (2,477) —
Reorganization gains, net (including cash payments $408) .................... — — (128,563) —
Provisions (benefits) for deferred taxes .................................... 242 (1,427) (600) 1,163
Change in other investments and miscellaneous assets ........................ (137) 292 596 (395)
Change in other operating assets and liabilities, net of acquisitions and disposals
(Note 36) ......................................................... (981) 3,372 (10,229) 94
Other .............................................................. 17 176 (1,253) (2,358)
Net cash provided by (used in) operating activities–Automotive ............... 6,589 1,064 (18,303) (12,065)
Net income–GM Financial ............................................. 90 — — —
Adjustments to reconcile income to net cash provided by operating activities ..... 86 — — —
Change in operating assets and liabilities .................................. 15 — — —
Net cash provided by operating activities–GM Financial ..................... 191 — — —
Net cash provided by (used in) operating activities .......................... 6,780 1,064 (18,303) (12,065)
Reference should be made to the notes to consolidated financial statements.
General Motors Company 2010 Annual Report 119