General Motors 2010 Annual Report Download - page 242
Download and view the complete annual report
Please find page 242 of the 2010 General Motors annual report below. You can navigate through the pages in the report by either clicking on the pages listed below, or by using the keyword search tool below to find specific information within the annual report.-
 1
1 -
2
-
3
-
4
-
5
-
6
-
7
-
8
-
9
-
10
-
11
-
12
-
13
-
14
-
15
-
16
-
17
-
18
-
19
-
20
-
21
-
22
-
23
-
24
-
25
-
26
-
27
-
28
-
29
-
30
-
31
-
32
-
33
-
34
-
35
-
36
-
37
-
38
-
39
-
40
-
41
-
42
-
43
-
44
-
45
-
46
-
47
-
48
-
49
-
50
-
51
-
52
-
53
-
54
-
55
-
56
-
57
-
58
-
59
-
60
-
61
-
62
-
63
-
64
-
65
-
66
-
67
-
68
-
69
-
70
-
71
-
72
-
73
-
74
-
75
-
76
-
77
-
78
-
79
-
80
-
81
-
82
-
83
-
84
-
85
-
86
-
87
-
88
-
89
-
90
-
91
-
92
-
93
-
94
-
95
-
96
-
97
-
98
-
99
-
100
-
101
-
102
-
103
-
104
-
105
-
106
-
107
-
108
-
109
-
110
-
111
-
112
-
113
-
114
-
115
-
116
-
117
-
118
-
119
-
120
-
121
-
122
-
123
-
124
-
125
-
126
-
127
-
128
-
129
-
130
-
131
-
132
-
133
-
134
-
135
-
136
-
137
-
138
-
139
-
140
-
141
-
142
-
143
-
144
-
145
-
146
-
147
-
148
-
149
-
150
-
151
-
152
-
153
-
154
-
155
-
156
-
157
-
158
-
159
-
160
-
161
-
162
-
163
-
164
-
165
-
166
-
167
-
168
-
169
-
170
-
171
-
172
-
173
-
174
-
175
-
176
-
177
-
178
-
179
-
180
-
181
-
182
-
183
-
184
-
185
-
186
-
187
-
188
-
189
-
190
-
191
-
192
-
193
-
194
-
195
-
196
-
197
-
198
-
199
-
200
-
201
-
202
-
203
-
204
-
205
-
206
-
207
-
208
-
209
-
210
-
211
-
212
-
213
-
214
-
215
-
216
-
217
-
218
-
219
-
220
-
221
-
222
-
223
-
224
-
225
-
226
-
227
-
228
-
229
-
230
-
231
-
 232
232 -
 233
233 -
 234
234 -
 235
235 -
 236
236 -
 237
237 -
 238
238 -
 239
239 -
 240
240 -
 241
241 -
 242
242 -
 243
243 -
 244
244 -
 245
245 -
 246
246 -
 247
247 -
 248
248 -
 249
249 -
 250
250 -
 251
251 -
 252
252 -
253
-
254
-
255
-
256
-
257
-
258
-
259
-
260
-
261
-
262
-
263
-
264
-
265
-
266
-
267
-
268
-
269
-
270
-
271
-
272
-
273
-
274
-
275
-
276
-
277
-
278
-
279
-
280
-
281
-
282
-
283
-
284
-
285
-
286
-
287
-
288
-
289
-
290
 |
 |

GENERAL MOTORS COMPANY AND SUBSIDIARIES
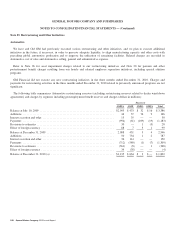
NOTES TO CONSOLIDATED FINANCIAL STATEMENTS — (Continued)
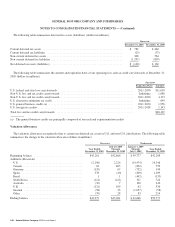
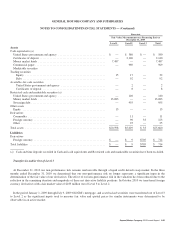
The following table summarizes deferred tax assets (liabilities) (dollars in millions):
Successor
December 31, 2010 December 31, 2009
Current deferred tax assets ........................................................ $ 782 $462
Current deferred tax liabilities ..................................................... (23) (57)
Non-current deferred tax assets ..................................................... 308 564
Non-current deferred tax liabilities .................................................. (1,207) (807)
Net deferred tax assets (liabilities) .................................................. $ (140) $ 162
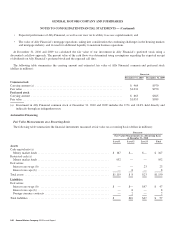
The following table summarizes the amount and expiration dates of our operating loss and tax credit carryforwards at December 31,
2010 (dollars in millions):
Successor
Expiration Dates Amounts
U.S. federal and state loss carryforwards ..................................................... 2011-2030 $11,050
Non-U.S. loss and tax credit carryforwards ................................................... Indefinite 1,088
Non-U.S. loss and tax credit carryforwards ................................................... 2011-2030 4,173
U.S. alternative minimum tax credit ......................................................... Indefinite 699
U.S. general business credits (a) ............................................................ 2011-2030 1,956
U.S. foreign tax credits ................................................................... 2011-2018 1,143
Total loss and tax credit carryforwards ...................................................... $20,109
(a) The general business credits are principally composed of research and experimentation credits.
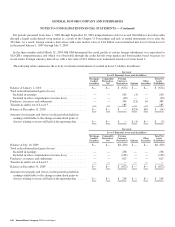
Valuation Allowances
The valuation allowances recognized relate to certain net deferred tax assets in U.S. and non-U.S. jurisdictions. The following table
summarizes the change in the valuation allowance (dollars in millions):
Successor Predecessor
Year Ended
December 31, 2010
July 10, 2009
Through
December 31, 2009
January 1, 2009
Through
July 9, 2009
Year Ended
December 31, 2008
Beginning balance ................................... $45,281 $42,666 $ 59,777 $42,208
Additions (Reversals)
U.S. ............................................ (2,196) 2,226 (14,474) 14,146
Canada .......................................... 63 405 (802) 759
Germany ........................................ (139) 67 (792) 140
Spain ........................................... 378 (40) (200) 1,109
Brazil ........................................... 1 1 (442) (135)
South Korea ...................................... (121) (221) 321 724
Australia ........................................ (39) 7 190 340
U.K. ............................................ (121) 109 62 330
Sweden ......................................... (58) 33 (1,057) (58)
Other ........................................... (70) 28 83 214
Ending balance ..................................... $42,979 $45,281 $ 42,666 $59,777
240 General Motors Company 2010 Annual Report