General Motors 2010 Annual Report Download - page 99
Download and view the complete annual report
Please find page 99 of the 2010 General Motors annual report below. You can navigate through the pages in the report by either clicking on the pages listed below, or by using the keyword search tool below to find specific information within the annual report.-
 1
1 -
2
-
3
-
4
-
5
-
6
-
7
-
8
-
9
-
10
-
11
-
12
-
13
-
14
-
15
-
16
-
17
-
18
-
19
-
20
-
21
-
22
-
23
-
24
-
25
-
26
-
27
-
28
-
29
-
30
-
31
-
32
-
33
-
34
-
35
-
36
-
37
-
38
-
39
-
40
-
41
-
42
-
43
-
44
-
45
-
46
-
47
-
48
-
49
-
50
-
51
-
52
-
53
-
54
-
55
-
56
-
57
-
58
-
59
-
60
-
61
-
62
-
63
-
64
-
65
-
66
-
67
-
68
-
69
-
70
-
71
-
72
-
73
-
74
-
75
-
76
-
77
-
78
-
79
-
80
-
81
-
82
-
83
-
84
-
85
-
86
-
87
-
88
-
 89
89 -
 90
90 -
 91
91 -
 92
92 -
 93
93 -
 94
94 -
 95
95 -
 96
96 -
 97
97 -
 98
98 -
 99
99 -
 100
100 -
 101
101 -
 102
102 -
 103
103 -
 104
104 -
 105
105 -
 106
106 -
 107
107 -
 108
108 -
 109
109 -
110
-
111
-
112
-
113
-
114
-
115
-
116
-
117
-
118
-
119
-
120
-
121
-
122
-
123
-
124
-
125
-
126
-
127
-
128
-
129
-
130
-
131
-
132
-
133
-
134
-
135
-
136
-
137
-
138
-
139
-
140
-
141
-
142
-
143
-
144
-
145
-
146
-
147
-
148
-
149
-
150
-
151
-
152
-
153
-
154
-
155
-
156
-
157
-
158
-
159
-
160
-
161
-
162
-
163
-
164
-
165
-
166
-
167
-
168
-
169
-
170
-
171
-
172
-
173
-
174
-
175
-
176
-
177
-
178
-
179
-
180
-
181
-
182
-
183
-
184
-
185
-
186
-
187
-
188
-
189
-
190
-
191
-
192
-
193
-
194
-
195
-
196
-
197
-
198
-
199
-
200
-
201
-
202
-
203
-
204
-
205
-
206
-
207
-
208
-
209
-
210
-
211
-
212
-
213
-
214
-
215
-
216
-
217
-
218
-
219
-
220
-
221
-
222
-
223
-
224
-
225
-
226
-
227
-
228
-
229
-
230
-
231
-
232
-
233
-
234
-
235
-
236
-
237
-
238
-
239
-
240
-
241
-
242
-
243
-
244
-
245
-
246
-
247
-
248
-
249
-
250
-
251
-
252
-
253
-
254
-
255
-
256
-
257
-
258
-
259
-
260
-
261
-
262
-
263
-
264
-
265
-
266
-
267
-
268
-
269
-
270
-
271
-
272
-
273
-
274
-
275
-
276
-
277
-
278
-
279
-
280
-
281
-
282
-
283
-
284
-
285
-
286
-
287
-
288
-
289
-
290
 |
 |

GENERAL MOTORS COMPANY AND SUBSIDIARIES
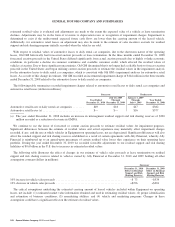
a high quality corporate yield curve to determine the present value of cash flows to calculate a single equivalent discount rate. Old
GM used an iterative process to determine the discount rate based on a hypothetical investment in a portfolio of high-quality bonds
rated AA or higher by a recognized rating agency and a hypothetical reinvestment of the proceeds of such bonds upon maturity using
forward rates derived from a yield curve until the U.S. pension obligation was defeased. This reinvestment component was
incorporated into the methodology because it was not feasible, in light of the magnitude and time horizon over which U.S. pension
obligations extend, to accomplish full defeasance through direct cash flows from an actual set of bonds selected at any given
measurement date.
The benefit obligation for pension plans in Canada, the United Kingdom and Germany comprise 92% of the non-U.S. pension
benefit obligation at December 31, 2010. The discount rates for Canadian plans are determined using a cash flow matching approach,
similar to the U.S. approach. The discount rates for plans in the United Kingdom and Germany use a curve derived from high quality
corporate bonds with maturities consistent with the plans’ underlying duration of expected benefit payments.
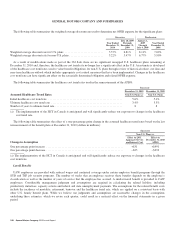
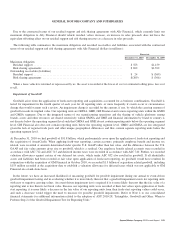
The following table summarizes rates used to determine net pension expense:
Successor Predecessor
Year Ended
December 31,
2010
July 10, 2009
Through
December 31,
2009
January 1, 2009
Through
July 9, 2009
Year Ended
December 31,
2008
Weighted-average expected long-term rate of return on U.S. plan assets . . . 8.48% 8.50% 8.50% 8.50%
Weighted-average expected long-term rate of return on non-U.S. plan
assets ...................................................... 7.42% 7.97% 7.74% 7.78%
Weighted-average discount rate for U.S. plan obligations ............... 5.36% 5.63% 6.27% 6.56%
Weighted-average discount rate for non-U.S. plan obligations ........... 5.19% 5.82% 6.23% 5.77%
Significant differences in actual experience or significant changes in assumptions may materially affect the pension obligations.
The effect of actual results differing from assumptions and the changing of assumptions are included in unamortized net actuarial
gains and losses that are subject to amortization to expense over future periods.
The following table summarizes the unamortized actuarial gain (before tax) on pension plans (dollars in billions):
Successor
December 31, 2010 December 31, 2009
Unamortized actuarial gain ........................................................ $2.9 $3.0
The following table summarizes the actual and expected return on pension plan assets (dollars in billions):
Successor Predecessor
Year Ended
December 31,
2010
July 10, 2009
Through
December 31,
2009
January 1,
2009
Through
July 9, 2009
Year Ended
December 31,
2008
U.S. actual return ................................................. $11.6 $9.9 $(0.2) $(11.4)
U.S. expected return ............................................... $ 6.6 $3.0 $ 3.8 $ 8.0
Non-U.S. actual return ............................................. $ 1.2 $1.2 $ 0.2 $ (2.9)
Non-U.S. expected return ........................................... $ 1.0 $0.4 $ 0.4 $ 1.0
General Motors Company 2010 Annual Report 97