General Motors 2010 Annual Report Download - page 259
Download and view the complete annual report
Please find page 259 of the 2010 General Motors annual report below. You can navigate through the pages in the report by either clicking on the pages listed below, or by using the keyword search tool below to find specific information within the annual report.-
 1
1 -
2
-
3
-
4
-
5
-
6
-
7
-
8
-
9
-
10
-
11
-
12
-
13
-
14
-
15
-
16
-
17
-
18
-
19
-
20
-
21
-
22
-
23
-
24
-
25
-
26
-
27
-
28
-
29
-
30
-
31
-
32
-
33
-
34
-
35
-
36
-
37
-
38
-
39
-
40
-
41
-
42
-
43
-
44
-
45
-
46
-
47
-
48
-
49
-
50
-
51
-
52
-
53
-
54
-
55
-
56
-
57
-
58
-
59
-
60
-
61
-
62
-
63
-
64
-
65
-
66
-
67
-
68
-
69
-
70
-
71
-
72
-
73
-
74
-
75
-
76
-
77
-
78
-
79
-
80
-
81
-
82
-
83
-
84
-
85
-
86
-
87
-
88
-
89
-
90
-
91
-
92
-
93
-
94
-
95
-
96
-
97
-
98
-
99
-
100
-
101
-
102
-
103
-
104
-
105
-
106
-
107
-
108
-
109
-
110
-
111
-
112
-
113
-
114
-
115
-
116
-
117
-
118
-
119
-
120
-
121
-
122
-
123
-
124
-
125
-
126
-
127
-
128
-
129
-
130
-
131
-
132
-
133
-
134
-
135
-
136
-
137
-
138
-
139
-
140
-
141
-
142
-
143
-
144
-
145
-
146
-
147
-
148
-
149
-
150
-
151
-
152
-
153
-
154
-
155
-
156
-
157
-
158
-
159
-
160
-
161
-
162
-
163
-
164
-
165
-
166
-
167
-
168
-
169
-
170
-
171
-
172
-
173
-
174
-
175
-
176
-
177
-
178
-
179
-
180
-
181
-
182
-
183
-
184
-
185
-
186
-
187
-
188
-
189
-
190
-
191
-
192
-
193
-
194
-
195
-
196
-
197
-
198
-
199
-
200
-
201
-
202
-
203
-
204
-
205
-
206
-
207
-
208
-
209
-
210
-
211
-
212
-
213
-
214
-
215
-
216
-
217
-
218
-
219
-
220
-
221
-
222
-
223
-
224
-
225
-
226
-
227
-
228
-
229
-
230
-
231
-
232
-
233
-
234
-
235
-
236
-
237
-
238
-
239
-
240
-
241
-
242
-
243
-
244
-
245
-
246
-
247
-
248
-
 249
249 -
 250
250 -
 251
251 -
 252
252 -
 253
253 -
 254
254 -
 255
255 -
 256
256 -
 257
257 -
 258
258 -
 259
259 -
 260
260 -
 261
261 -
 262
262 -
 263
263 -
 264
264 -
 265
265 -
 266
266 -
 267
267 -
 268
268 -
 269
269 -
270
-
271
-
272
-
273
-
274
-
275
-
276
-
277
-
278
-
279
-
280
-
281
-
282
-
283
-
284
-
285
-
286
-
287
-
288
-
289
-
290
 |
 |

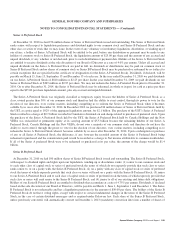
GENERAL MOTORS COMPANY AND SUBSIDIARIES
NOTES TO CONSOLIDATED FINANCIAL STATEMENTS — (Continued)
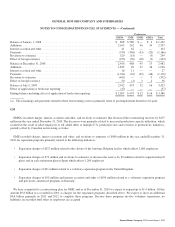
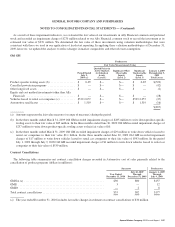
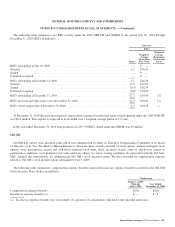
As a result of these impairment indicators, we evaluated the fair value of our investments in Ally Financial common and preferred
stock and recorded an impairment charge of $270 million related to our Ally Financial common stock to record the investment at its
estimated fair value of $970 million. We determined the fair value of these investments using valuation methodologies that were
consistent with those we used in our application of fresh-start reporting. In applying these valuation methodologies at December 31,
2009, however, we updated the analyses to reflect changes in market comparables and other relevant assumptions.
Old GM
Predecessor
Period Ended
July 9,
2009 (a)
Fair Value Measurements Using
January 1, 2009
Through July 9,
2009
Total Losses
Quoted Prices in
Active Markets
for Identical
Assets
(Level 1)
Significant Other
Observable
Inputs
(Level 2)
Significant
Unobservable
Inputs
(Level 3)
Product-specific tooling assets (b) ................. $ 0-85 $— $— $ 0-85 $(522)
Cancelled powertrain programs ................... $ — $— $— $ — (42)
Other long-lived assets .......................... $ — $— $— $ — (2)
Equity and cost method investments (other than Ally
Financial) .................................. $ — $— $— $ — (28)
Vehicles leased to rental car companies (c) .......... $539-2,057 $— $— $539-2,057 (47)
Automotive retail leases ......................... $ 1,519 $— $— $ 1,519 (16)
$(657)
(a) Amounts represent the fair value measure (or range of measures) during the period.
(b) In the three months ended March 31, 2009 Old GM recorded impairment charges of $285 million to write down product-specific
tooling assets to their fair value of $85 million. In the three months ended June 30, 2009 Old GM recorded impairment charges of
$237 million to write down product-specific tooling assets to their fair value of $0.
(c) In the three months ended March 31, 2009 Old GM recorded impairment charges of $29 million to write down vehicles leased to
rental car companies to their fair value $2.1 billion. In the three months ended June 30, 2009 Old GM recorded impairment
charges of $17 million to write down vehicles leased to rental car companies to their fair value of $543 million. In the period
July 1, 2009 through July 9, 2009 Old GM recorded impairment charges of $1 million to write down vehicles leased to rental car
companies to their fair value of $539 million.
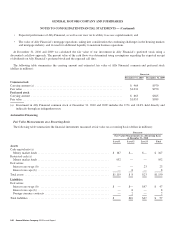
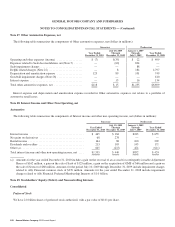
Contract Cancellations
The following table summarizes net contract cancellation charges recorded in Automotive cost of sales primarily related to the
cancellation of product programs (dollars in millions):
Successor Predecessor
Year Ended
December 31, 2010
July 10, 2009
Through
December 31, 2009
January 1, 2009
Through
July 9, 2009
GMNA (a) ........................................................ $30 $80 $157
GME ............................................................ 3 — 12
GMIO ........................................................... — 2 8
Total contract cancellations ........................................... $33 $82 $177
(a) The year ended December 31, 2010 includes favorable changes in estimate on contract cancellations of $30 million.
General Motors Company 2010 Annual Report 257