General Motors 2010 Annual Report Download - page 68
Download and view the complete annual report
Please find page 68 of the 2010 General Motors annual report below. You can navigate through the pages in the report by either clicking on the pages listed below, or by using the keyword search tool below to find specific information within the annual report.-
 1
1 -
2
-
3
-
4
-
5
-
6
-
7
-
8
-
9
-
10
-
11
-
12
-
13
-
14
-
15
-
16
-
17
-
18
-
19
-
20
-
21
-
22
-
23
-
24
-
25
-
26
-
27
-
28
-
29
-
30
-
31
-
32
-
33
-
34
-
35
-
36
-
37
-
38
-
39
-
40
-
41
-
42
-
43
-
44
-
45
-
46
-
47
-
48
-
49
-
50
-
51
-
52
-
53
-
54
-
55
-
56
-
57
-
 58
58 -
 59
59 -
 60
60 -
 61
61 -
 62
62 -
 63
63 -
 64
64 -
 65
65 -
 66
66 -
 67
67 -
 68
68 -
 69
69 -
 70
70 -
 71
71 -
 72
72 -
 73
73 -
 74
74 -
 75
75 -
 76
76 -
 77
77 -
 78
78 -
79
-
80
-
81
-
82
-
83
-
84
-
85
-
86
-
87
-
88
-
89
-
90
-
91
-
92
-
93
-
94
-
95
-
96
-
97
-
98
-
99
-
100
-
101
-
102
-
103
-
104
-
105
-
106
-
107
-
108
-
109
-
110
-
111
-
112
-
113
-
114
-
115
-
116
-
117
-
118
-
119
-
120
-
121
-
122
-
123
-
124
-
125
-
126
-
127
-
128
-
129
-
130
-
131
-
132
-
133
-
134
-
135
-
136
-
137
-
138
-
139
-
140
-
141
-
142
-
143
-
144
-
145
-
146
-
147
-
148
-
149
-
150
-
151
-
152
-
153
-
154
-
155
-
156
-
157
-
158
-
159
-
160
-
161
-
162
-
163
-
164
-
165
-
166
-
167
-
168
-
169
-
170
-
171
-
172
-
173
-
174
-
175
-
176
-
177
-
178
-
179
-
180
-
181
-
182
-
183
-
184
-
185
-
186
-
187
-
188
-
189
-
190
-
191
-
192
-
193
-
194
-
195
-
196
-
197
-
198
-
199
-
200
-
201
-
202
-
203
-
204
-
205
-
206
-
207
-
208
-
209
-
210
-
211
-
212
-
213
-
214
-
215
-
216
-
217
-
218
-
219
-
220
-
221
-
222
-
223
-
224
-
225
-
226
-
227
-
228
-
229
-
230
-
231
-
232
-
233
-
234
-
235
-
236
-
237
-
238
-
239
-
240
-
241
-
242
-
243
-
244
-
245
-
246
-
247
-
248
-
249
-
250
-
251
-
252
-
253
-
254
-
255
-
256
-
257
-
258
-
259
-
260
-
261
-
262
-
263
-
264
-
265
-
266
-
267
-
268
-
269
-
270
-
271
-
272
-
273
-
274
-
275
-
276
-
277
-
278
-
279
-
280
-
281
-
282
-
283
-
284
-
285
-
286
-
287
-
288
-
289
-
290
 |
 |

GENERAL MOTORS COMPANY AND SUBSIDIARIES
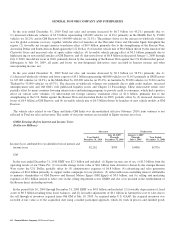
In the year ended December 31, 2010 Total net sales and revenue increased by $6.7 billion (or 45.2%) primarily due to:
(1) increased wholesale volumes of $3.9 billion representing 118,000 vehicles (or 11.8%) primarily in the Middle East by 35,000
vehicles (or 28.2%) and in GM Daewoo by 100,000 vehicles (or 21.1%). The primary driver for the increase in wholesale volumes
was the global economic recovery, together with the effect of launches of the Chevrolet Cruze and Chevrolet Spark throughout the
region; (2) favorable net foreign currency translation effect of $0.9 billion, primarily due to the strengthening of the Korean Won,
Australian Dollar and South African Rand against the U.S. Dollar; (3) favorable vehicle mix of $0.8 billion driven by the launch of the
Chevrolet Cruze and increased sales of sports utility vehicles; (4) favorable vehicle pricing effect of $0.1 billion, primarily due to
higher pricing on new model launches at GM Daewoo; and (5) derivative losses of $0.8 billion in the period January 1, 2009 through
July 9, 2009, that did not recur in 2010, primarily driven by the weakening of the Korean Won against the U.S. Dollar in that period.
Subsequent to July 10, 2009, all gains and losses on non-designated derivatives were recorded in Interest income and other
non-operating income, net.
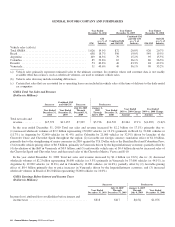
In the year ended December 31, 2009 Total net sales and revenue decreased by $9.3 billion (or 38.5%) primarily due to:
(1) decreased wholesale volumes and lower exports of $9.1 billion representing 460,000 vehicles (or 31.6%) primarily in GM Daewoo
by 247,000 vehicles (or 34.2%), in the Middle East by 103,000 vehicles (or 45.4%), in Australia by 59,000 vehicles (or 32.6%) and in
Thailand by 53,000 vehicles (or 69.7%). The decrease in wholesale volumes was primarily due to tight credit markets, increased
unemployment rates and Old GM’s well publicized liquidity issues and Chapter 11 Proceedings. These unfavorable trends were
partially offset by many countries lowering interest rates and initiating programs to provide credit to consumers, which had a positive
effect on vehicle sales volumes; (2) unfavorable net foreign currency translation effect of $1.0 billion, primarily due to the
strengthening of the U.S. Dollar against the Korean Won and Australian Dollar in 2009, partially offset by (3) decreased derivative
losses of $0.9 billion at GM Daewoo; and (4) favorable vehicle mix of $0.3 billion driven by launches of new vehicle models at GM
Daewoo.
The vehicle sales related to our China and India (GM India was deconsolidated effective February 2010) joint ventures is not
reflected in Total net sales and revenue. The results of our joint ventures are recorded in Equity income, net of tax.
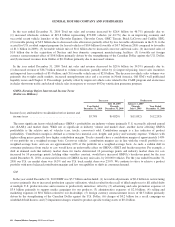
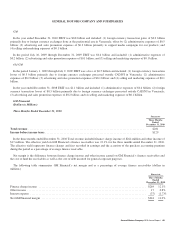
GMIO Earnings Before Interest and Income Taxes
(Dollars in Millions)
Successor Predecessor
Year Ended
December 31, 2010
July 10, 2009
Through
December 31, 2009
January 1, 2009
Through
July 9, 2009
Year Ended
December 31, 2008
Income (loss) attributable to stockholders before interest and
income taxes .................................... $2,262 $789 $(486) $(555)
GM
In the year ended December 31, 2010 EBIT was $2.3 billion and included: (1) Equity income, net of tax, of $1.3 billion from the
operating results of our China JVs; (2) favorable change in fair value of $0.1 billion from derivatives driven by the stronger Korean
Won versus the U.S. Dollar; partially offset by (3) administrative expenses of $0.8 billion; (4) advertising and sales promotion
expenses of $0.6 billion primarily to support media campaigns for our products; (5) unfavorable non-controlling interest attributable
to minority shareholders of GM Daewoo and General Motors Egypt (GM Egypt) of $0.3 billion; and (6) selling and marketing
expenses of $0.2 billion related to labor costs in the selling department across GMIO and also costs incurred in the establishment of
the Korean direct dealership network.
In the period July 10, 2009 through December 31, 2009 EBIT was $0.8 billion and included: (1) favorable depreciation of fixed
assets of $0.3 billion resulting from lower balances; and (2) favorable adjustments of $0.1 billion in Automotive cost of sales due to
the sell through of inventory acquired from Old GM at July 10, 2009. As required under U.S. GAAP, the acquired inventory was
recorded at fair value as of the acquisition date using a market participant approach, which for work in process and finished goods
66 General Motors Company 2010 Annual Report