General Motors 2010 Annual Report Download - page 94
Download and view the complete annual report
Please find page 94 of the 2010 General Motors annual report below. You can navigate through the pages in the report by either clicking on the pages listed below, or by using the keyword search tool below to find specific information within the annual report.-
 1
1 -
2
-
3
-
4
-
5
-
6
-
7
-
8
-
9
-
10
-
11
-
12
-
13
-
14
-
15
-
16
-
17
-
18
-
19
-
20
-
21
-
22
-
23
-
24
-
25
-
26
-
27
-
28
-
29
-
30
-
31
-
32
-
33
-
34
-
35
-
36
-
37
-
38
-
39
-
40
-
41
-
42
-
43
-
44
-
45
-
46
-
47
-
48
-
49
-
50
-
51
-
52
-
53
-
54
-
55
-
56
-
57
-
58
-
59
-
60
-
61
-
62
-
63
-
64
-
65
-
66
-
67
-
68
-
69
-
70
-
71
-
72
-
73
-
74
-
75
-
76
-
77
-
78
-
79
-
80
-
81
-
82
-
83
-
 84
84 -
 85
85 -
 86
86 -
 87
87 -
 88
88 -
 89
89 -
 90
90 -
 91
91 -
 92
92 -
 93
93 -
 94
94 -
 95
95 -
 96
96 -
 97
97 -
 98
98 -
 99
99 -
 100
100 -
 101
101 -
 102
102 -
 103
103 -
 104
104 -
105
-
106
-
107
-
108
-
109
-
110
-
111
-
112
-
113
-
114
-
115
-
116
-
117
-
118
-
119
-
120
-
121
-
122
-
123
-
124
-
125
-
126
-
127
-
128
-
129
-
130
-
131
-
132
-
133
-
134
-
135
-
136
-
137
-
138
-
139
-
140
-
141
-
142
-
143
-
144
-
145
-
146
-
147
-
148
-
149
-
150
-
151
-
152
-
153
-
154
-
155
-
156
-
157
-
158
-
159
-
160
-
161
-
162
-
163
-
164
-
165
-
166
-
167
-
168
-
169
-
170
-
171
-
172
-
173
-
174
-
175
-
176
-
177
-
178
-
179
-
180
-
181
-
182
-
183
-
184
-
185
-
186
-
187
-
188
-
189
-
190
-
191
-
192
-
193
-
194
-
195
-
196
-
197
-
198
-
199
-
200
-
201
-
202
-
203
-
204
-
205
-
206
-
207
-
208
-
209
-
210
-
211
-
212
-
213
-
214
-
215
-
216
-
217
-
218
-
219
-
220
-
221
-
222
-
223
-
224
-
225
-
226
-
227
-
228
-
229
-
230
-
231
-
232
-
233
-
234
-
235
-
236
-
237
-
238
-
239
-
240
-
241
-
242
-
243
-
244
-
245
-
246
-
247
-
248
-
249
-
250
-
251
-
252
-
253
-
254
-
255
-
256
-
257
-
258
-
259
-
260
-
261
-
262
-
263
-
264
-
265
-
266
-
267
-
268
-
269
-
270
-
271
-
272
-
273
-
274
-
275
-
276
-
277
-
278
-
279
-
280
-
281
-
282
-
283
-
284
-
285
-
286
-
287
-
288
-
289
-
290
 |
 |

GENERAL MOTORS COMPANY AND SUBSIDIARIES
For periods presented from June 1, 2009 through September 30, 2009 nonperformance risk for us and Old GM was not observable
through a liquid credit default swap market as a result of the Chapter 11 Proceedings and lack of traded instruments for us after the
363 Sale. Foreign currency derivatives with a fair market value of $1.6 billion were transferred from Level 2 to Level 3 in the period
January 1, 2009 through July 9, 2009.
In the three months ended March 31, 2009 Old GM determined the credit profile of certain foreign subsidiaries was equivalent to
Old GM’s nonperformance risk which was observable through the credit default swap market and bond market based on prices for
recent trades. Foreign currency derivatives with a fair value of $2.1 billion were transferred from Level 3 into Level 2.
Realized gains and losses related to assets and liabilities measured using Level 3 inputs did not have a material effect on operations,
liquidity or capital resources in the year ended December 31, 2010 and the periods July 10, 2009 through December 31,
2009, January 1, 2009 through July 9, 2009 and the year ended December 31, 2008.
Automotive Financing
At December 31, 2010 significant assets and liabilities classified in Level 3, with the related Level 3 inputs, are as follows:
• Interest rate swaps – Level 3 inputs are used to determine the fair value of GM Financial’s interest rate swaps because they are
not exchange traded but instead traded in over-the-counter markets where quoted market prices are not readily available. The
fair value of derivatives is derived using models that primarily use market observable inputs, such as interest rate yield curves
and credit curves. The effects of GM Financial’s and the counterparties’ non-performance risk to the derivative trades is
considered when measuring the fair value of derivative assets and liabilities.
Refer to Notes 21 and 24 to our consolidated financial statements for additional information regarding fair value measurements.
Dividends
The declaration of any dividend on our common stock is a matter to be acted upon by our Board of Directors in its sole discretion.
Since our formation, we have not paid any dividends on our common stock. We have no current plans to pay any dividends on our
common stock. Our payment of dividends on our common stock in the future, if any, will be determined by our Board of Directors in
its sole discretion out of funds legally available for that purpose and will depend on business conditions, our financial condition,
earnings, liquidity and capital requirements, the covenants in our debt instruments, and other factors.
So long as any share of our Series A or B Preferred Stock remains outstanding, no dividend or distribution may be declared or paid
on our common stock unless all accrued and unpaid dividends have been paid on our Series A and B Preferred Stock, subject to
exceptions, such as dividends on our common stock payable solely in shares of our common stock. Our secured revolving credit
facility contains certain restrictions on our ability to pay dividends, subject to exceptions, such as dividends payable solely in shares of
our common stock.
So long as any share of our Series A Preferred Stock remains outstanding, no dividend or distribution may be declared or paid on
our Series B Preferred Stock unless all accrued and unpaid dividends have been paid on our Series A Preferred Stock, subject to
exceptions, such as dividends on our Series B Preferred Stock solely in shares of our common stock.
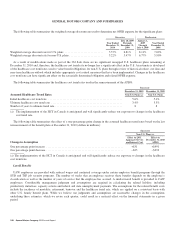
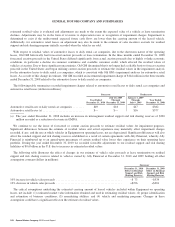
The following tables summarize dividends paid on our Series A and B Preferred Stock (dollars in millions):
Three Months
Ended
December 31, 2010
Three Months
Ended
September 30, 2010
Three Months
Ended
June 30, 2010
Three Months
Ended
March 31, 2010
Year Ended
December 31, 2010
Total
Series A Preferred Stock (a) .................... $202 $203 $202 $203 $810
Series B Preferred Stock (b) .................... — — — — —
Total Preferred Stock dividends paid ............. $202 $203 $202 $203 $810
(a) Does not include the $677 million charge related to the purchase of 84 million shares of Series A Preferred Stock from the UST.
(b) At December 31, 2010 cumulative unpaid dividends on our Series B Preferred Stock was $25 million.
92 General Motors Company 2010 Annual Report