General Motors 2010 Annual Report Download - page 106
Download and view the complete annual report
Please find page 106 of the 2010 General Motors annual report below. You can navigate through the pages in the report by either clicking on the pages listed below, or by using the keyword search tool below to find specific information within the annual report.-
 1
1 -
2
-
3
-
4
-
5
-
6
-
7
-
8
-
9
-
10
-
11
-
12
-
13
-
14
-
15
-
16
-
17
-
18
-
19
-
20
-
21
-
22
-
23
-
24
-
25
-
26
-
27
-
28
-
29
-
30
-
31
-
32
-
33
-
34
-
35
-
36
-
37
-
38
-
39
-
40
-
41
-
42
-
43
-
44
-
45
-
46
-
47
-
48
-
49
-
50
-
51
-
52
-
53
-
54
-
55
-
56
-
57
-
58
-
59
-
60
-
61
-
62
-
63
-
64
-
65
-
66
-
67
-
68
-
69
-
70
-
71
-
72
-
73
-
74
-
75
-
76
-
77
-
78
-
79
-
80
-
81
-
82
-
83
-
84
-
85
-
86
-
87
-
88
-
89
-
90
-
91
-
92
-
93
-
94
-
95
-
 96
96 -
 97
97 -
 98
98 -
 99
99 -
 100
100 -
 101
101 -
 102
102 -
 103
103 -
 104
104 -
 105
105 -
 106
106 -
 107
107 -
 108
108 -
 109
109 -
 110
110 -
 111
111 -
 112
112 -
 113
113 -
 114
114 -
 115
115 -
 116
116 -
117
-
118
-
119
-
120
-
121
-
122
-
123
-
124
-
125
-
126
-
127
-
128
-
129
-
130
-
131
-
132
-
133
-
134
-
135
-
136
-
137
-
138
-
139
-
140
-
141
-
142
-
143
-
144
-
145
-
146
-
147
-
148
-
149
-
150
-
151
-
152
-
153
-
154
-
155
-
156
-
157
-
158
-
159
-
160
-
161
-
162
-
163
-
164
-
165
-
166
-
167
-
168
-
169
-
170
-
171
-
172
-
173
-
174
-
175
-
176
-
177
-
178
-
179
-
180
-
181
-
182
-
183
-
184
-
185
-
186
-
187
-
188
-
189
-
190
-
191
-
192
-
193
-
194
-
195
-
196
-
197
-
198
-
199
-
200
-
201
-
202
-
203
-
204
-
205
-
206
-
207
-
208
-
209
-
210
-
211
-
212
-
213
-
214
-
215
-
216
-
217
-
218
-
219
-
220
-
221
-
222
-
223
-
224
-
225
-
226
-
227
-
228
-
229
-
230
-
231
-
232
-
233
-
234
-
235
-
236
-
237
-
238
-
239
-
240
-
241
-
242
-
243
-
244
-
245
-
246
-
247
-
248
-
249
-
250
-
251
-
252
-
253
-
254
-
255
-
256
-
257
-
258
-
259
-
260
-
261
-
262
-
263
-
264
-
265
-
266
-
267
-
268
-
269
-
270
-
271
-
272
-
273
-
274
-
275
-
276
-
277
-
278
-
279
-
280
-
281
-
282
-
283
-
284
-
285
-
286
-
287
-
288
-
289
-
290
 |
 |

GENERAL MOTORS COMPANY AND SUBSIDIARIES
Future goodwill impairments could occur should the fair value-to-U.S. GAAP adjustments differences decrease. Goodwill
predominately resulted from our recorded liabilities for certain employee benefit obligations being higher than the fair value of these
obligations because lower discount rates were utilized in determining the U.S. GAAP values compared to those utilized to determine
fair values. The discount rates utilized to determine the fair value of these obligations were based on our incremental borrowing rates,
which included our nonperformance risk. Our incremental borrowing rates are also affected by changes in market interest rates.
Further, the recorded amounts of our assets were lower than their fair values because of the recording of valuation allowances on
certain of our deferred tax assets. The difference between these fair value-to-U.S. GAAP amounts would decrease upon an
improvement in our credit rating, thus resulting in a decrease in the spread between our employee benefit related obligations under
U.S. GAAP and their fair values. A decrease will also occur upon reversal of our deferred tax asset valuation allowances. Should the
fair value-to-U.S. GAAP adjustments differences decrease for these reasons, the implied goodwill balance will decline. Accordingly,
at the next annual or event-driven goodwill impairment test, to the extent the carrying amount of a reporting unit exceeds its fair
value, a goodwill impairment could occur. Future goodwill impairments could also occur should we reorganize our internal reporting
structure in a manner that changes the composition of one or more of our reporting units. Upon such an event, goodwill would be
reassigned to the affected reporting units using a relative-fair-value allocation approach, unless the entity was never integrated, and
not based on the amount of goodwill that was originally attributable to fair value-to-U.S. GAAP differences that gave rise to goodwill.
When performing our goodwill impairment testing, the fair values of our reporting units were determined based on valuation
techniques using the best available information, primarily discounted cash flow projections. We make significant assumptions and
estimates about the extent and timing of future cash flows, growth rates and discount rates. The cash flows are estimated over a
significant future period of time, which makes those estimates and assumptions subject to a high degree of uncertainty. Where
available and as appropriate, comparative market multiples and the quoted market price of our common stock are used to corroborate
the results of the discounted cash flow method. While we believe that the assumptions and estimates used to determine the estimated
fair values of each of our reporting units are reasonable, a change in assumptions underlying these estimates could result in a material
effect on the consolidated financial statements. Assumptions used in our discounted cash flow analysis that have the most significant
effect on the estimated fair value of our reporting units include:
• Our estimated WACC;
• Our estimated long-term growth rates; and
• Our estimate of industry sales and our market share.
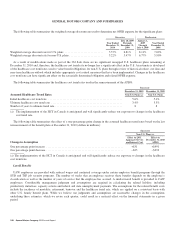
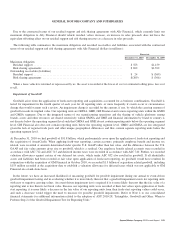
During the three months ended December 31, 2010 we performed our annual goodwill impairment testing for all reporting units.
Based on this testing, we determined that goodwill was not impaired. The valuation methodologies utilized to perform our goodwill
impairment testing were consistent with those used in our application of fresh-start reporting on July 10, 2009, as discussed in Note 2
to our consolidated financial statements, and in any subsequent annual or event-driven impairment tests and resulted in Level 3
measures. The following table summarizes the key assumptions for each of our more significant reporting units utilized in our 2010
annual goodwill impairment testing as of October 1, 2010 (dollars and volumes in millions):
Goodwill
Amount as
of October 1,
2010 WACC
Long-Term
Growth Rates
Industry
Sales Market Share
2011 2014 2011 2014
GMNA .............................................. $26,410 16.5% 1.5% 15.9 20.2 18.5% 18.2%
GME ................................................ $ 3,096 17.0% 0.5% 18.4 21.3 6.8% 7.6%
GM Daewoo (a) ....................................... $ 632 16.0% 3.0% 77.9 91.8 1.2% 1.4%
Holden ............................................... $ 186 14.5% 3.0% 1.0 1.1 12.4% 13.5%
GM Mercosur ......................................... $ 120 15.3% 4.7% 4.6 5.4 18.6% 17.0%
(a) Industry sales volume and market share for GM Daewoo are based on global industry volumes as GM Daewoo exports vehicles
globally.
104 General Motors Company 2010 Annual Report