General Motors 2010 Annual Report Download - page 141
Download and view the complete annual report
Please find page 141 of the 2010 General Motors annual report below. You can navigate through the pages in the report by either clicking on the pages listed below, or by using the keyword search tool below to find specific information within the annual report.-
 1
1 -
2
-
3
-
4
-
5
-
6
-
7
-
8
-
9
-
10
-
11
-
12
-
13
-
14
-
15
-
16
-
17
-
18
-
19
-
20
-
21
-
22
-
23
-
24
-
25
-
26
-
27
-
28
-
29
-
30
-
31
-
32
-
33
-
34
-
35
-
36
-
37
-
38
-
39
-
40
-
41
-
42
-
43
-
44
-
45
-
46
-
47
-
48
-
49
-
50
-
51
-
52
-
53
-
54
-
55
-
56
-
57
-
58
-
59
-
60
-
61
-
62
-
63
-
64
-
65
-
66
-
67
-
68
-
69
-
70
-
71
-
72
-
73
-
74
-
75
-
76
-
77
-
78
-
79
-
80
-
81
-
82
-
83
-
84
-
85
-
86
-
87
-
88
-
89
-
90
-
91
-
92
-
93
-
94
-
95
-
96
-
97
-
98
-
99
-
100
-
101
-
102
-
103
-
104
-
105
-
106
-
107
-
108
-
109
-
110
-
111
-
112
-
113
-
114
-
115
-
116
-
117
-
118
-
119
-
120
-
121
-
122
-
123
-
124
-
125
-
126
-
127
-
128
-
129
-
130
-
 131
131 -
 132
132 -
 133
133 -
 134
134 -
 135
135 -
 136
136 -
 137
137 -
 138
138 -
 139
139 -
 140
140 -
 141
141 -
 142
142 -
 143
143 -
 144
144 -
 145
145 -
 146
146 -
 147
147 -
 148
148 -
 149
149 -
 150
150 -
 151
151 -
152
-
153
-
154
-
155
-
156
-
157
-
158
-
159
-
160
-
161
-
162
-
163
-
164
-
165
-
166
-
167
-
168
-
169
-
170
-
171
-
172
-
173
-
174
-
175
-
176
-
177
-
178
-
179
-
180
-
181
-
182
-
183
-
184
-
185
-
186
-
187
-
188
-
189
-
190
-
191
-
192
-
193
-
194
-
195
-
196
-
197
-
198
-
199
-
200
-
201
-
202
-
203
-
204
-
205
-
206
-
207
-
208
-
209
-
210
-
211
-
212
-
213
-
214
-
215
-
216
-
217
-
218
-
219
-
220
-
221
-
222
-
223
-
224
-
225
-
226
-
227
-
228
-
229
-
230
-
231
-
232
-
233
-
234
-
235
-
236
-
237
-
238
-
239
-
240
-
241
-
242
-
243
-
244
-
245
-
246
-
247
-
248
-
249
-
250
-
251
-
252
-
253
-
254
-
255
-
256
-
257
-
258
-
259
-
260
-
261
-
262
-
263
-
264
-
265
-
266
-
267
-
268
-
269
-
270
-
271
-
272
-
273
-
274
-
275
-
276
-
277
-
278
-
279
-
280
-
281
-
282
-
283
-
284
-
285
-
286
-
287
-
288
-
289
-
290
 |
 |
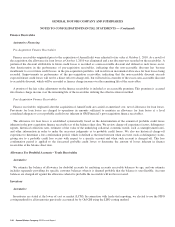
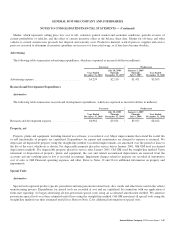
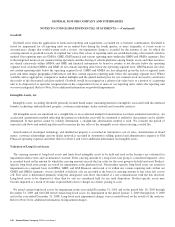
GENERAL MOTORS COMPANY AND SUBSIDIARIES
NOTES TO CONSOLIDATED FINANCIAL STATEMENTS — (Continued)
• Royalty rates based on licensing arrangements for similar technologies and obsolescence factors by technology
category;
• Discount rates ranging from 24.0% to 26.0% based on our WACC and adjusted for perceived business risks related
to these developed technologies; and
• Estimated economic lives, which ranged from seven to 20 years.
• The excess earnings method was used to determine the fair value of in-process research and development of $175 million.
The significant assumptions used in this approach included:
• Forecasted revenue for certain technologies not yet proven to be commercially feasible;
• The probability and cost of obtaining commercial feasibility;
• Discount rates ranging from 4.2% (when the probability of obtaining commercial feasibility was considered
elsewhere in the model) to 36.0%; and
• Estimated economic lives ranging from approximately 10 to 20 years.
• The relief from royalty method was also used to calculate the fair value of brand names of $5.5 billion. The significant
assumptions used in this method included:
• Forecasted revenue for each brand name by Old GM’s former segments;
• Royalty rates based on licensing arrangements for the use of brands and trademarks in the automotive industry and related
industries;
• Discount rates ranging from 22.8% to 27.0% based on our WACC and adjusted for perceived business risks related to
these intangible assets; and
• Indefinite economic lives for our ongoing brands.
• Our most significant brands included Buick, Cadillac, Chevrolet, GMC, Opel/Vauxhall and OnStar. We also recorded
defensive intangible assets associated with brands we eliminated, which included Pontiac, Saturn and Oldsmobile.
• A cost approach was used to calculate the fair value of our dealer networks and customer relationships of $2.1 billion. The
estimated fair value of our dealer networks of $1.6 billion was determined by multiplying our estimated costs to recreate our
dealer networks by our estimate of an optimal number of dealers. An income approach was used to calculate the fair value of
our customer relationships of $508 million. The significant assumptions used in this approach included:
• Forecasted revenue;
• Customer retention rates;
• Profit margins; and
• A discount rate of 20.8% based on an appropriate WACC and adjusted for perceived business risks related to these
customer relationships.
• We recorded other intangible assets of $560 million primarily related to existing contracts, including leasehold improvements,
that were favorable relative to available market terms.
General Motors Company 2010 Annual Report 139