General Motors 2010 Annual Report Download - page 276
Download and view the complete annual report
Please find page 276 of the 2010 General Motors annual report below. You can navigate through the pages in the report by either clicking on the pages listed below, or by using the keyword search tool below to find specific information within the annual report.-
 1
1 -
2
-
3
-
4
-
5
-
6
-
7
-
8
-
9
-
10
-
11
-
12
-
13
-
14
-
15
-
16
-
17
-
18
-
19
-
20
-
21
-
22
-
23
-
24
-
25
-
26
-
27
-
28
-
29
-
30
-
31
-
32
-
33
-
34
-
35
-
36
-
37
-
38
-
39
-
40
-
41
-
42
-
43
-
44
-
45
-
46
-
47
-
48
-
49
-
50
-
51
-
52
-
53
-
54
-
55
-
56
-
57
-
58
-
59
-
60
-
61
-
62
-
63
-
64
-
65
-
66
-
67
-
68
-
69
-
70
-
71
-
72
-
73
-
74
-
75
-
76
-
77
-
78
-
79
-
80
-
81
-
82
-
83
-
84
-
85
-
86
-
87
-
88
-
89
-
90
-
91
-
92
-
93
-
94
-
95
-
96
-
97
-
98
-
99
-
100
-
101
-
102
-
103
-
104
-
105
-
106
-
107
-
108
-
109
-
110
-
111
-
112
-
113
-
114
-
115
-
116
-
117
-
118
-
119
-
120
-
121
-
122
-
123
-
124
-
125
-
126
-
127
-
128
-
129
-
130
-
131
-
132
-
133
-
134
-
135
-
136
-
137
-
138
-
139
-
140
-
141
-
142
-
143
-
144
-
145
-
146
-
147
-
148
-
149
-
150
-
151
-
152
-
153
-
154
-
155
-
156
-
157
-
158
-
159
-
160
-
161
-
162
-
163
-
164
-
165
-
166
-
167
-
168
-
169
-
170
-
171
-
172
-
173
-
174
-
175
-
176
-
177
-
178
-
179
-
180
-
181
-
182
-
183
-
184
-
185
-
186
-
187
-
188
-
189
-
190
-
191
-
192
-
193
-
194
-
195
-
196
-
197
-
198
-
199
-
200
-
201
-
202
-
203
-
204
-
205
-
206
-
207
-
208
-
209
-
210
-
211
-
212
-
213
-
214
-
215
-
216
-
217
-
218
-
219
-
220
-
221
-
222
-
223
-
224
-
225
-
226
-
227
-
228
-
229
-
230
-
231
-
232
-
233
-
234
-
235
-
236
-
237
-
238
-
239
-
240
-
241
-
242
-
243
-
244
-
245
-
246
-
247
-
248
-
249
-
250
-
251
-
252
-
253
-
254
-
255
-
256
-
257
-
258
-
259
-
260
-
261
-
262
-
263
-
264
-
265
-
 266
266 -
 267
267 -
 268
268 -
 269
269 -
 270
270 -
 271
271 -
 272
272 -
 273
273 -
 274
274 -
 275
275 -
 276
276 -
 277
277 -
 278
278 -
 279
279 -
 280
280 -
 281
281 -
 282
282 -
 283
283 -
 284
284 -
 285
285 -
 286
286 -
287
-
288
-
289
-
290
 |
 |

GENERAL MOTORS COMPANY AND SUBSIDIARIES
NOTES TO CONSOLIDATED FINANCIAL STATEMENTS — (Continued)
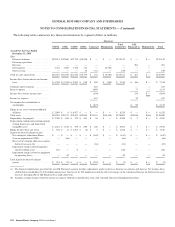
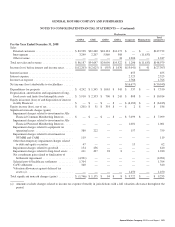
Note 34. Supplementary Quarterly Financial Information (Unaudited)
Consolidated
The following tables summarize supplementary quarterly financial information (dollars in millions, except per share amounts):
Successor
1st Quarter 2nd Quarter 3rd Quarter 4th Quarter
2010
Total net sales and revenue ............................................. $31,476 $33,174 $34,060 $36,882
Automotive gross margin .............................................. $ 3,885 $ 4,415 $ 4,592 $ 3,627
Net income ......................................................... $ 1,196 $ 1,612 $ 2,223 $ 1,472
Net income attributable to common stockholders ........................... $ 865 $ 1,334 $ 1,959 $ 510
Net income attributable to common stockholders, per share, basic .............. $ 0.58 $ 0.89 $ 1.31 $ 0.34
Net income attributable to common stockholders, per share, diluted ............ $ 0.55 $ 0.85 $ 1.20 $ 0.31
Successor Predecessor
July 10, 2009
Through
September 30,
2009 4th Quarter 1st Quarter 2nd Quarter
July 1, 2009
Through
July 9,
2009
2009
Total net sales and revenue .................................. $25,147 $32,327 $22,431 $ 23,047 $ 1,637
Automotive gross margin (loss) .............................. $ 1,593 $ (500) $ (2,180) $ (6,337) $ (182)
Net income (loss) .......................................... $ (571) $ (3,215) $ (5,899) $(13,237) $128,139
Net income (loss) attributable to common stockholders ............ $ (908) $ (3,520) $ (5,975) $(12,905) $127,998
Net income (loss) attributable to common stockholders, per share,
basic .................................................. $ (0.73) $ (2.84) $ (9.78) $ (21.12) $ 209.49
Net income (loss) attributable to common stockholders, per share,
diluted ................................................ $ (0.73) $ (2.84) $ (9.78) $ (21.12) $ 209.38
GM
Results for the three months ended December 31, 2010 included:
• A charge of $677 million related to our purchase of 84 million shares of Series A Preferred Stock from the UST.
• A reversal of our $231 million liability for contingently issuable Adjustment Shares based on a revised assessment of the
estimate of allowed general unsecured claims against MLC.
• A gain of $198 million related to our repayment of the VEBA Notes of $2.8 billion.
• Restructuring reserve decrease of $183 million in GMNA primarily related to capacity actions and revisions to productivity
initiatives.
• Restructuring charges and interest accretion and other of $154 million in GME primarily related to separation programs
announced in Belgium, Spain, Germany and the United Kingdom.
• Income before income taxes and equity income and net income of $129 million and $90 million related to the October 1, 2010
acquisition of GM Financial including net income of $10 million related to amounts recorded to reflect the changes in the
valuation allowance on deferred tax assets that were not applicable to GM Financial on a stand-alone basis.
274 General Motors Company 2010 Annual Report