General Motors 2010 Annual Report Download - page 176
Download and view the complete annual report
Please find page 176 of the 2010 General Motors annual report below. You can navigate through the pages in the report by either clicking on the pages listed below, or by using the keyword search tool below to find specific information within the annual report.-
 1
1 -
2
-
3
-
4
-
5
-
6
-
7
-
8
-
9
-
10
-
11
-
12
-
13
-
14
-
15
-
16
-
17
-
18
-
19
-
20
-
21
-
22
-
23
-
24
-
25
-
26
-
27
-
28
-
29
-
30
-
31
-
32
-
33
-
34
-
35
-
36
-
37
-
38
-
39
-
40
-
41
-
42
-
43
-
44
-
45
-
46
-
47
-
48
-
49
-
50
-
51
-
52
-
53
-
54
-
55
-
56
-
57
-
58
-
59
-
60
-
61
-
62
-
63
-
64
-
65
-
66
-
67
-
68
-
69
-
70
-
71
-
72
-
73
-
74
-
75
-
76
-
77
-
78
-
79
-
80
-
81
-
82
-
83
-
84
-
85
-
86
-
87
-
88
-
89
-
90
-
91
-
92
-
93
-
94
-
95
-
96
-
97
-
98
-
99
-
100
-
101
-
102
-
103
-
104
-
105
-
106
-
107
-
108
-
109
-
110
-
111
-
112
-
113
-
114
-
115
-
116
-
117
-
118
-
119
-
120
-
121
-
122
-
123
-
124
-
125
-
126
-
127
-
128
-
129
-
130
-
131
-
132
-
133
-
134
-
135
-
136
-
137
-
138
-
139
-
140
-
141
-
142
-
143
-
144
-
145
-
146
-
147
-
148
-
149
-
150
-
151
-
152
-
153
-
154
-
155
-
156
-
157
-
158
-
159
-
160
-
161
-
162
-
163
-
164
-
165
-
 166
166 -
 167
167 -
 168
168 -
 169
169 -
 170
170 -
 171
171 -
 172
172 -
 173
173 -
 174
174 -
 175
175 -
 176
176 -
 177
177 -
 178
178 -
 179
179 -
 180
180 -
 181
181 -
 182
182 -
 183
183 -
 184
184 -
 185
185 -
 186
186 -
187
-
188
-
189
-
190
-
191
-
192
-
193
-
194
-
195
-
196
-
197
-
198
-
199
-
200
-
201
-
202
-
203
-
204
-
205
-
206
-
207
-
208
-
209
-
210
-
211
-
212
-
213
-
214
-
215
-
216
-
217
-
218
-
219
-
220
-
221
-
222
-
223
-
224
-
225
-
226
-
227
-
228
-
229
-
230
-
231
-
232
-
233
-
234
-
235
-
236
-
237
-
238
-
239
-
240
-
241
-
242
-
243
-
244
-
245
-
246
-
247
-
248
-
249
-
250
-
251
-
252
-
253
-
254
-
255
-
256
-
257
-
258
-
259
-
260
-
261
-
262
-
263
-
264
-
265
-
266
-
267
-
268
-
269
-
270
-
271
-
272
-
273
-
274
-
275
-
276
-
277
-
278
-
279
-
280
-
281
-
282
-
283
-
284
-
285
-
286
-
287
-
288
-
289
-
290
 |
 |

GENERAL MOTORS COMPANY AND SUBSIDIARIES
NOTES TO CONSOLIDATED FINANCIAL STATEMENTS — (Continued)
In May 2009 the UST exercised this option, the outstanding principal and interest under the UST Ally Financial Loan was
extinguished, and Old GM recorded a net gain of $483 million. The net gain was comprised of a gain on the disposition of Ally
Financial Common Membership Interests of $2.5 billion recorded in Equity in income of and disposition of interest in Ally Financial
and a loss on extinguishment of the UST Ally Financial Loan of $2.0 billion recorded in Loss on extinguishment of debt. After the
exchange, Old GM’s ownership was reduced to 24.5% of Ally Financial’s Common Membership Interests.
Ally Financial converted its status to a C corporation effective June 30, 2009. At that date, Old GM began to account for its
investment in Ally Financial using the cost method rather than the equity method as Old GM could not exercise significant influence
over Ally Financial. Prior to converting to a C corporation, Old GM’s investment in Ally Financial was accounted for in a manner
similar to an investment in a limited liability partnership and the equity method was applied because Old GM’s influence was more
than minor. In connection with Ally Financial’s conversion into a C corporation, each unit of each class of Ally Financial Membership
Interests was converted into shares of capital stock of Ally Financial with substantially the same rights and preferences as such
Membership Interests. On July 10, 2009 we acquired the investment in Ally Financial’s common and preferred stocks in connection
with the 363 Sale.
In December 2009 the UST made a capital contribution to Ally Financial of $3.8 billion. The UST also exchanged all of its existing
Ally Financial non-convertible preferred stock for newly issued mandatory convertible preferred securities valued at $5.3 billion and
converted mandatory convertible preferred securities valued at $3.0 billion into Ally Financial common stock. These actions resulted
in the dilution of our investment in Ally Financial common stock from 24.5% to 16.6%, of which 6.7% was held directly and 9.9%
was held indirectly through an independent trust.
In December 2010 the UST agreed to convert its optional conversion feature on the shares of mandatory convertible preferred
securities held by the UST. Through this transaction, Ally Financial converted 110 million shares of preferred securities into
532 thousand shares of common stock. This action resulted in the dilution of our investment in Ally Financial common stock from
16.6% to 9.9%, of which 4.0% is held directly and 5.9% is held indirectly through an independent trust. Pursuant to previous
commitments to reduce influence over and ownership in Ally Financial, the trustee, who is independent of us, has the sole authority to
vote and is required to dispose of all Ally Financial common stock held in the trust by December 24, 2011. We can cause the trustee to
return any Ally Financial common stock to us to hold directly, so long as our directly held voting and total common equity interests
remain below 10%.
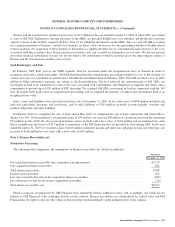
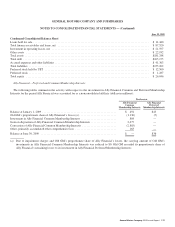
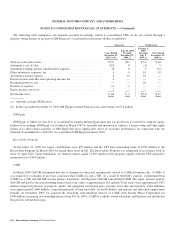
The following tables summarize financial information of Ally Financial for the period Ally Financial was accounted for as a
nonconsolidated affiliate (dollars in millions):
Six Months
Ended
June 30, 2009
Year Ended
December 31, 2008
Consolidated Statement of Income (Loss)
Total financing revenue and other interest income ......................................... $6,916 $18,054
Total interest expense ................................................................ $3,936 $10,441
Depreciation expense on operating lease assets ............................................ $2,113 $ 5,478
Gain on extinguishment of debt ........................................................ $ 657 $12,628
Total other revenue .................................................................. $2,117 $15,271
Total noninterest expense ............................................................. $3,381 $ 8,349
Loss from continuing operations before income tax expense ................................. $(2,260) $ 4,737
Income tax expense from continuing operations ........................................... $ 972 $ (136)
Net income (loss) from continuing operations ............................................. $(3,232) $ 4,873
Loss from discontinued operations, net of tax ............................................. $(1,346) $ (3,005)
Net income (loss) ................................................................... $(4,578) $ 1,868
174 General Motors Company 2010 Annual Report