General Motors 2010 Annual Report Download - page 47
Download and view the complete annual report
Please find page 47 of the 2010 General Motors annual report below. You can navigate through the pages in the report by either clicking on the pages listed below, or by using the keyword search tool below to find specific information within the annual report.-
 1
1 -
2
-
3
-
4
-
5
-
6
-
7
-
8
-
9
-
10
-
11
-
12
-
13
-
14
-
15
-
16
-
17
-
18
-
19
-
20
-
21
-
22
-
23
-
24
-
25
-
26
-
27
-
28
-
29
-
30
-
31
-
32
-
33
-
34
-
35
-
36
-
 37
37 -
 38
38 -
 39
39 -
 40
40 -
 41
41 -
 42
42 -
 43
43 -
 44
44 -
 45
45 -
 46
46 -
 47
47 -
 48
48 -
 49
49 -
 50
50 -
 51
51 -
 52
52 -
 53
53 -
 54
54 -
 55
55 -
 56
56 -
 57
57 -
58
-
59
-
60
-
61
-
62
-
63
-
64
-
65
-
66
-
67
-
68
-
69
-
70
-
71
-
72
-
73
-
74
-
75
-
76
-
77
-
78
-
79
-
80
-
81
-
82
-
83
-
84
-
85
-
86
-
87
-
88
-
89
-
90
-
91
-
92
-
93
-
94
-
95
-
96
-
97
-
98
-
99
-
100
-
101
-
102
-
103
-
104
-
105
-
106
-
107
-
108
-
109
-
110
-
111
-
112
-
113
-
114
-
115
-
116
-
117
-
118
-
119
-
120
-
121
-
122
-
123
-
124
-
125
-
126
-
127
-
128
-
129
-
130
-
131
-
132
-
133
-
134
-
135
-
136
-
137
-
138
-
139
-
140
-
141
-
142
-
143
-
144
-
145
-
146
-
147
-
148
-
149
-
150
-
151
-
152
-
153
-
154
-
155
-
156
-
157
-
158
-
159
-
160
-
161
-
162
-
163
-
164
-
165
-
166
-
167
-
168
-
169
-
170
-
171
-
172
-
173
-
174
-
175
-
176
-
177
-
178
-
179
-
180
-
181
-
182
-
183
-
184
-
185
-
186
-
187
-
188
-
189
-
190
-
191
-
192
-
193
-
194
-
195
-
196
-
197
-
198
-
199
-
200
-
201
-
202
-
203
-
204
-
205
-
206
-
207
-
208
-
209
-
210
-
211
-
212
-
213
-
214
-
215
-
216
-
217
-
218
-
219
-
220
-
221
-
222
-
223
-
224
-
225
-
226
-
227
-
228
-
229
-
230
-
231
-
232
-
233
-
234
-
235
-
236
-
237
-
238
-
239
-
240
-
241
-
242
-
243
-
244
-
245
-
246
-
247
-
248
-
249
-
250
-
251
-
252
-
253
-
254
-
255
-
256
-
257
-
258
-
259
-
260
-
261
-
262
-
263
-
264
-
265
-
266
-
267
-
268
-
269
-
270
-
271
-
272
-
273
-
274
-
275
-
276
-
277
-
278
-
279
-
280
-
281
-
282
-
283
-
284
-
285
-
286
-
287
-
288
-
289
-
290
 |
 |

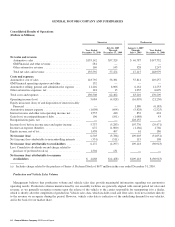
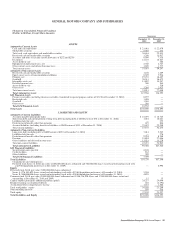
GENERAL MOTORS COMPANY AND SUBSIDIARIES
The following tables summarize total production volume and sales of new motor vehicles and competitive position (in thousands):
GM
Combined GM
and Old GM Old GM
Year Ended
December 31, 2010
Year Ended
December 31, 2009
Year Ended
December 31, 2008
Production Volume (a)
GMNA ......................................................... 2,809 1,913 3,449
GME .......................................................... 1,234 1,106 1,495
GMIO (b) ....................................................... 3,745 2,677 2,335
GMSA ......................................................... 926 807 865
Worldwide ...................................................... 8,714 6,503 8,144
(a) Production volume includes vehicles produced by certain joint ventures.
(b) The joint venture agreements with SGMW (44%) and FAW-GM (50%) allow for significant rights as a member as well as the
contractual right to report SGMW and FAW-GM joint venture production in China.
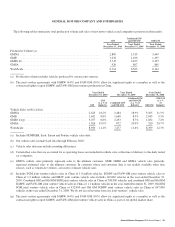
Year Ended
December 31, 2010
Year Ended
December 31, 2009
Year Ended
December 31, 2008
GM
GM
asa%of
Industry
Combined GM
and Old GM
Combined GM
and Old GM
asa%of
Industry Old GM
Old GM
as a %
of
Industry
Vehicle Sales (a)(b)(c)(d)(e)
GMNA .............................................. 2,625 18.2% 2,484 18.9% 3,565 21.5%
GME ................................................ 1,662 8.8% 1,668 8.9% 2,043 9.3%
GMIO (f)(g) .......................................... 3,077 8.8% 2,453 8.7% 1,832 7.4%
GMSA ............................................... 1,026 19.9% 872 20.0% 920 20.7%
Worldwide ........................................... 8,390 11.4% 7,477 11.6% 8,359 12.3%
(a) Includes HUMMER, Saab, Saturn and Pontiac vehicle sales data.
(b) Our vehicle sales include Saab data through February 2010.
(c) Vehicle sales data may include rounding differences.
(d) Certain fleet sales that are accounted for as operating leases are included in vehicle sales at the time of delivery to the daily rental
car companies.
(e) GMNA vehicle sales primarily represent sales to the ultimate customer. GME, GMIO and GMSA vehicle sales primarily
represent estimated sales to the ultimate customer. In countries where end customer data is not readily available other data
sources, such as wholesale volumes, are used to estimate vehicle sales.
(f) Includes SGM joint venture vehicle sales in China of 1.0 million vehicles, SGMW and FAW-GM joint venture vehicle sales in
China of 1.3 million vehicles and HKJV joint venture vehicle sales in India 110,000 vehicles in the year ended December 31,
2010. Combined GM and Old GM SGM joint venture vehicle sales in China of 708,000 vehicles and combined GM and Old GM
SGMW and FAW-GM joint venture vehicle sales in China of 1.1 million vehicles in the year ended December 31, 2009. Old GM
SGM joint venture vehicle sales in China of 432,000 and Old GM SGMW joint venture vehicle sales in China of 647,000
vehicles in the year ended December 31, 2008. We do not record revenue from our joint ventures’ vehicle sales.
(g) The joint venture agreements with SGMW (44%) and FAW-GM (50%) allow for significant rights as a member as well as the
contractual right to report SGMW and FAW-GM joint venture vehicle sales in China as part of our global market share.
General Motors Company 2010 Annual Report 45