General Motors 2010 Annual Report Download - page 139
Download and view the complete annual report
Please find page 139 of the 2010 General Motors annual report below. You can navigate through the pages in the report by either clicking on the pages listed below, or by using the keyword search tool below to find specific information within the annual report.-
 1
1 -
2
-
3
-
4
-
5
-
6
-
7
-
8
-
9
-
10
-
11
-
12
-
13
-
14
-
15
-
16
-
17
-
18
-
19
-
20
-
21
-
22
-
23
-
24
-
25
-
26
-
27
-
28
-
29
-
30
-
31
-
32
-
33
-
34
-
35
-
36
-
37
-
38
-
39
-
40
-
41
-
42
-
43
-
44
-
45
-
46
-
47
-
48
-
49
-
50
-
51
-
52
-
53
-
54
-
55
-
56
-
57
-
58
-
59
-
60
-
61
-
62
-
63
-
64
-
65
-
66
-
67
-
68
-
69
-
70
-
71
-
72
-
73
-
74
-
75
-
76
-
77
-
78
-
79
-
80
-
81
-
82
-
83
-
84
-
85
-
86
-
87
-
88
-
89
-
90
-
91
-
92
-
93
-
94
-
95
-
96
-
97
-
98
-
99
-
100
-
101
-
102
-
103
-
104
-
105
-
106
-
107
-
108
-
109
-
110
-
111
-
112
-
113
-
114
-
115
-
116
-
117
-
118
-
119
-
120
-
121
-
122
-
123
-
124
-
125
-
126
-
127
-
128
-
 129
129 -
 130
130 -
 131
131 -
 132
132 -
 133
133 -
 134
134 -
 135
135 -
 136
136 -
 137
137 -
 138
138 -
 139
139 -
 140
140 -
 141
141 -
 142
142 -
 143
143 -
 144
144 -
 145
145 -
 146
146 -
 147
147 -
 148
148 -
 149
149 -
150
-
151
-
152
-
153
-
154
-
155
-
156
-
157
-
158
-
159
-
160
-
161
-
162
-
163
-
164
-
165
-
166
-
167
-
168
-
169
-
170
-
171
-
172
-
173
-
174
-
175
-
176
-
177
-
178
-
179
-
180
-
181
-
182
-
183
-
184
-
185
-
186
-
187
-
188
-
189
-
190
-
191
-
192
-
193
-
194
-
195
-
196
-
197
-
198
-
199
-
200
-
201
-
202
-
203
-
204
-
205
-
206
-
207
-
208
-
209
-
210
-
211
-
212
-
213
-
214
-
215
-
216
-
217
-
218
-
219
-
220
-
221
-
222
-
223
-
224
-
225
-
226
-
227
-
228
-
229
-
230
-
231
-
232
-
233
-
234
-
235
-
236
-
237
-
238
-
239
-
240
-
241
-
242
-
243
-
244
-
245
-
246
-
247
-
248
-
249
-
250
-
251
-
252
-
253
-
254
-
255
-
256
-
257
-
258
-
259
-
260
-
261
-
262
-
263
-
264
-
265
-
266
-
267
-
268
-
269
-
270
-
271
-
272
-
273
-
274
-
275
-
276
-
277
-
278
-
279
-
280
-
281
-
282
-
283
-
284
-
285
-
286
-
287
-
288
-
289
-
290
 |
 |
GENERAL MOTORS COMPANY AND SUBSIDIARIES
NOTES TO CONSOLIDATED FINANCIAL STATEMENTS — (Continued)
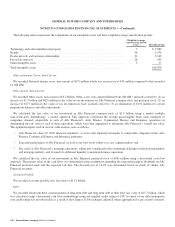
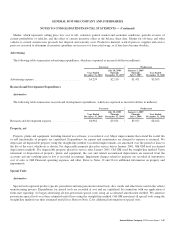
• Raw materials were determined based on current replacement cost.
Compared to amounts recorded by Old GM, finished goods increased by $622 million, including elimination of Old GM’s LIFO
reserve of $1.1 billion, work in process decreased by $555 million, raw materials decreased by $39 million and sundry items with
nominal individual value decreased by $94 million.
Equipment on Operating Leases, Current and Non-Current
We recorded Equipment on operating leases, current and non-current at its fair value of $3.9 billion, which was determined as
follows: (1) automotive leases to daily rental car companies were determined based on the market value of comparable vehicles; and
(2) automotive retail leases were determined by discounting the expected future cash flows generated by the automotive retail leases
including the estimated residual value of the vehicles when sold. Equipment on operating leases, current and non-current increased
from that recorded by Old GM by $93 million as a result of our determination of fair value.
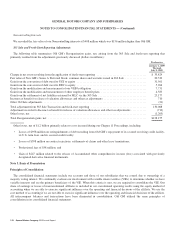
Other Current Assets and Deferred Income Taxes
We recorded Other current assets which included prepaid assets and other current assets at their fair value of $1.5 billion and
deferred income taxes of $487 million. These amounts are $69 million higher than the amounts recorded by Old GM.
Equity in Net Assets of Nonconsolidated Affiliates
We recorded Equity in net assets of nonconsolidated affiliates at its fair value of $5.8 billion. Fair value of these investments was
determined using discounted cash flow analyses, which included the following assumptions and estimates:
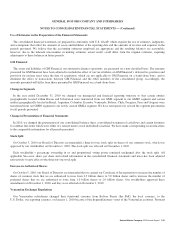
• Forecasted cash flows for the seven months ended December 31, 2009 and the years ending 2010 through 2013, which
incorporated projected sales volumes, product mixes, projected capital spending to support existing and future products,
research and development of new products and technologies and anticipated changes in local market conditions;
• A terminal value, which was calculated by assuming a maintainable level of after-tax debt-free cash flow and multiplying it by
a capitalization factor that reflected the investor’s WACC adjusted for the estimated long-term perpetual growth rate;
• A discount rate of 13.4% that considered various factors including risk premiums and tax rates to determine the investor’s
WACC given the assumed capital structure of comparable companies; and
• The fair value of investment property and investments in affiliates was determined using market comparables.
Equity in net assets of nonconsolidated affiliates was higher than Old GM’s by $3.8 billion as a result of our determination of fair
value.
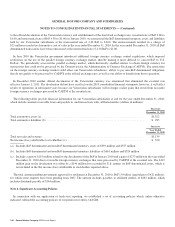
Property
We recorded Property, which includes land, buildings and land improvements, machinery and equipment, construction in progress
and special tools, at its fair value of $18.5 billion. Fair value was based on the highest and best use of specific properties. To
determine fair value we considered and applied three approaches:
• The market or sales comparison approach which relies upon recent sales or offerings of similar assets on the market to arrive
at a probable selling price. Certain adjustments were made to reconcile differences in attributes between the comparable sales
and the appraised assets. This method was utilized for certain assets related to land, buildings and land improvements and
information technology.
• The cost approach which considers the amount required to construct or purchase a new asset of equal utility at current prices,
with adjustments in value for physical deterioration, functional obsolescence and economic obsolescence. This method was
General Motors Company 2010 Annual Report 137