General Motors 2010 Annual Report Download - page 207
Download and view the complete annual report
Please find page 207 of the 2010 General Motors annual report below. You can navigate through the pages in the report by either clicking on the pages listed below, or by using the keyword search tool below to find specific information within the annual report.-
 1
1 -
2
-
3
-
4
-
5
-
6
-
7
-
8
-
9
-
10
-
11
-
12
-
13
-
14
-
15
-
16
-
17
-
18
-
19
-
20
-
21
-
22
-
23
-
24
-
25
-
26
-
27
-
28
-
29
-
30
-
31
-
32
-
33
-
34
-
35
-
36
-
37
-
38
-
39
-
40
-
41
-
42
-
43
-
44
-
45
-
46
-
47
-
48
-
49
-
50
-
51
-
52
-
53
-
54
-
55
-
56
-
57
-
58
-
59
-
60
-
61
-
62
-
63
-
64
-
65
-
66
-
67
-
68
-
69
-
70
-
71
-
72
-
73
-
74
-
75
-
76
-
77
-
78
-
79
-
80
-
81
-
82
-
83
-
84
-
85
-
86
-
87
-
88
-
89
-
90
-
91
-
92
-
93
-
94
-
95
-
96
-
97
-
98
-
99
-
100
-
101
-
102
-
103
-
104
-
105
-
106
-
107
-
108
-
109
-
110
-
111
-
112
-
113
-
114
-
115
-
116
-
117
-
118
-
119
-
120
-
121
-
122
-
123
-
124
-
125
-
126
-
127
-
128
-
129
-
130
-
131
-
132
-
133
-
134
-
135
-
136
-
137
-
138
-
139
-
140
-
141
-
142
-
143
-
144
-
145
-
146
-
147
-
148
-
149
-
150
-
151
-
152
-
153
-
154
-
155
-
156
-
157
-
158
-
159
-
160
-
161
-
162
-
163
-
164
-
165
-
166
-
167
-
168
-
169
-
170
-
171
-
172
-
173
-
174
-
175
-
176
-
177
-
178
-
179
-
180
-
181
-
182
-
183
-
184
-
185
-
186
-
187
-
188
-
189
-
190
-
191
-
192
-
193
-
194
-
195
-
196
-
 197
197 -
 198
198 -
 199
199 -
 200
200 -
 201
201 -
 202
202 -
 203
203 -
 204
204 -
 205
205 -
 206
206 -
 207
207 -
 208
208 -
 209
209 -
 210
210 -
 211
211 -
 212
212 -
 213
213 -
 214
214 -
 215
215 -
 216
216 -
 217
217 -
218
-
219
-
220
-
221
-
222
-
223
-
224
-
225
-
226
-
227
-
228
-
229
-
230
-
231
-
232
-
233
-
234
-
235
-
236
-
237
-
238
-
239
-
240
-
241
-
242
-
243
-
244
-
245
-
246
-
247
-
248
-
249
-
250
-
251
-
252
-
253
-
254
-
255
-
256
-
257
-
258
-
259
-
260
-
261
-
262
-
263
-
264
-
265
-
266
-
267
-
268
-
269
-
270
-
271
-
272
-
273
-
274
-
275
-
276
-
277
-
278
-
279
-
280
-
281
-
282
-
283
-
284
-
285
-
286
-
287
-
288
-
289
-
290
 |
 |

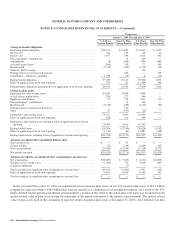
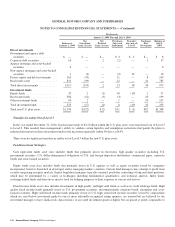
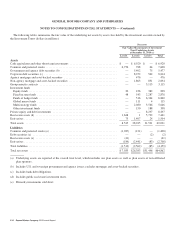
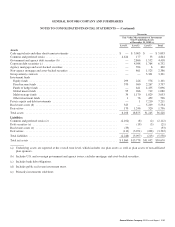
GENERAL MOTORS COMPANY AND SUBSIDIARIES
NOTES TO CONSOLIDATED FINANCIAL STATEMENTS — (Continued)
Predecessor
U.S. Plans
Pension Benefits
Non-U.S. Plans
Pension Benefits
U.S. Plans
Other Benefits
Non-U.S. Plans
Other Benefits
January 1, 2009
Through
July 9,
2009
Year Ended
December 31,
2008
January 1, 2009
Through
July 9,
2009
Year Ended
December 31,
2008
January 1, 2009
Through
July 9,
2009
Year Ended
December 31,
2008
January 1, 2009
Through
July 9,
2009
Year Ended
December 31,
2008
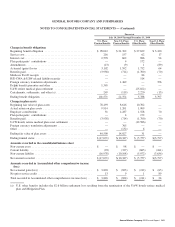
Components of expense
Service cost .......... $ 243 $ 527 $ 155 $ 410 $ 69 $ 241 $ 12 $ 32
Interest cost .......... 3,077 5,493 596 1,269 1,615 3,519 102 225
Expected return on plan
assets ............. (3,810) (8,043) (364) (969) (444) (1,281) — —
Amortization of prior
service cost (credit) . . 429 1,077 (12) 407 (1,051) (1,918) (63) (86)
Amortization of
transition
obligation .......... — — 2 6————
Recognized net actuarial
loss ............... 715 317 193 275 32 508 23 110
Curtailments,
settlements, and other
losses (gains) ....... 1,720 3,823 97 270 21 (3,476) (123) 11
Net periodic pension and
OPEB (income)
expense ............ $2,374 $ 3,194 $ 667 $ 1,668 $ 242 $(2,407) $ (49) $ 292
Weighted-average
assumptions used to
determine benefit
obligations at period
end
Discount rate ......... 5.86% 6.27% 5.82% 6.22% 6.86% 8.25% 5.47% 7.00%
Rate of compensation
increase ............ 3.94% 5.00% 3.23% 3.59% 1.48% 2.10% 4.45% 4.45%
Weighted-average
assumptions used to
determine net
expense for the
period (a)
Discount rate ......... 6.27% 6.56% 6.23% 5.77% 8.11% 7.02% 6.77% 5.90%
Expected return on plan
assets ............. 8.50% 8.50% 7.74% 7.78% 8.50% 8.40% — —
Rate of compensation
increase ............ 5.00% 5.00% 3.08% 3.59% 1.87% 3.30% 4.45% 4.00%
(a) Determined at the beginning of the period and updated for remeasurements. Appropriate discount rates were used to measure the effects of curtailments
and plan amendments on various plans.
General Motors Company 2010 Annual Report 205