General Motors 2010 Annual Report Download - page 178
Download and view the complete annual report
Please find page 178 of the 2010 General Motors annual report below. You can navigate through the pages in the report by either clicking on the pages listed below, or by using the keyword search tool below to find specific information within the annual report.-
 1
1 -
2
-
3
-
4
-
5
-
6
-
7
-
8
-
9
-
10
-
11
-
12
-
13
-
14
-
15
-
16
-
17
-
18
-
19
-
20
-
21
-
22
-
23
-
24
-
25
-
26
-
27
-
28
-
29
-
30
-
31
-
32
-
33
-
34
-
35
-
36
-
37
-
38
-
39
-
40
-
41
-
42
-
43
-
44
-
45
-
46
-
47
-
48
-
49
-
50
-
51
-
52
-
53
-
54
-
55
-
56
-
57
-
58
-
59
-
60
-
61
-
62
-
63
-
64
-
65
-
66
-
67
-
68
-
69
-
70
-
71
-
72
-
73
-
74
-
75
-
76
-
77
-
78
-
79
-
80
-
81
-
82
-
83
-
84
-
85
-
86
-
87
-
88
-
89
-
90
-
91
-
92
-
93
-
94
-
95
-
96
-
97
-
98
-
99
-
100
-
101
-
102
-
103
-
104
-
105
-
106
-
107
-
108
-
109
-
110
-
111
-
112
-
113
-
114
-
115
-
116
-
117
-
118
-
119
-
120
-
121
-
122
-
123
-
124
-
125
-
126
-
127
-
128
-
129
-
130
-
131
-
132
-
133
-
134
-
135
-
136
-
137
-
138
-
139
-
140
-
141
-
142
-
143
-
144
-
145
-
146
-
147
-
148
-
149
-
150
-
151
-
152
-
153
-
154
-
155
-
156
-
157
-
158
-
159
-
160
-
161
-
162
-
163
-
164
-
165
-
166
-
167
-
 168
168 -
 169
169 -
 170
170 -
 171
171 -
 172
172 -
 173
173 -
 174
174 -
 175
175 -
 176
176 -
 177
177 -
 178
178 -
 179
179 -
 180
180 -
 181
181 -
 182
182 -
 183
183 -
 184
184 -
 185
185 -
 186
186 -
 187
187 -
 188
188 -
189
-
190
-
191
-
192
-
193
-
194
-
195
-
196
-
197
-
198
-
199
-
200
-
201
-
202
-
203
-
204
-
205
-
206
-
207
-
208
-
209
-
210
-
211
-
212
-
213
-
214
-
215
-
216
-
217
-
218
-
219
-
220
-
221
-
222
-
223
-
224
-
225
-
226
-
227
-
228
-
229
-
230
-
231
-
232
-
233
-
234
-
235
-
236
-
237
-
238
-
239
-
240
-
241
-
242
-
243
-
244
-
245
-
246
-
247
-
248
-
249
-
250
-
251
-
252
-
253
-
254
-
255
-
256
-
257
-
258
-
259
-
260
-
261
-
262
-
263
-
264
-
265
-
266
-
267
-
268
-
269
-
270
-
271
-
272
-
273
-
274
-
275
-
276
-
277
-
278
-
279
-
280
-
281
-
282
-
283
-
284
-
285
-
286
-
287
-
288
-
289
-
290
 |
 |

GENERAL MOTORS COMPANY AND SUBSIDIARIES
NOTES TO CONSOLIDATED FINANCIAL STATEMENTS — (Continued)
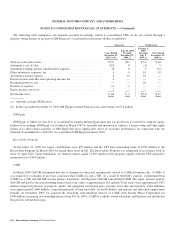
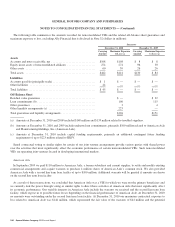
Note 12. Property, net
Automotive
The following table summarizes the components of Property, net (dollars in millions):
Successor
Estimated
Useful Lives
(Years)
December 31,
2010
Estimated
Useful Lives
(Years)
December 31,
2009
Land ............................................................ — $ 2,536 — $ 2,602
Buildings and land improvements ..................................... 2-40 4,324 2-40 4,292
Machinery and equipment ........................................... 3-30 8,727 3-30 6,686
Construction in progress ............................................ — 1,754 — 1,649
Real estate, plants, and equipment ..................................... 17,341 15,229
Less accumulated depreciation ....................................... (3,277) (1,285)
Real estate, plants, and equipment, net ................................. 14,064 13,944
Special tools, net .................................................. 1-13 5,171 1-13 4,743
Total property, net ................................................. $19,235 $18,687
The following table summarizes the amount of interest capitalized and excluded from Automotive interest expense related to
Property, net (dollars in millions):
Successor Predecessor
Year Ended
December 31, 2010
July 10, 2009
Through
December 31, 2009
January 1, 2009
Through
July 9, 2009
Year Ended
December 31, 2008
Capitalized interest .................................. $62 $21 $28 $576
The following table summarizes the amount of capitalized software included in Property, net (dollars in millions):
Successor
December 31, 2010 December 31, 2009
Capitalized software in use, net .................................................... $287 $263
Capitalized software in the process of being developed .................................. $ 96 $ 81
The following table summarizes depreciation, impairment charges and amortization expense related to Property, net, recorded in
Automotive cost of sales, Automotive selling, general and administrative expense and Other automotive expenses, net (dollars in
millions):
Successor Predecessor
Year Ended
December 31, 2010
July 10, 2009
Through
December 31, 2009
January 1, 2009
Through
July 9, 2009
Year Ended
December 31, 2008
Depreciation and impairment of long-lived assets .......... $1,988 $1,355 $4,352 $4,863
Amortization and impairment of special tools ............. 1,826 865 2,139 3,493
Total depreciation, impairment charges and amortization
expense ......................................... $3,814 $2,220 $6,491 $8,356
Capitalized software amortization expense (a) ............. $ 195 $ 132 $ 136 $ 209
(a) Included in Total depreciation, impairment charges and amortization expense.
176 General Motors Company 2010 Annual Report