General Motors 2010 Annual Report Download - page 215
Download and view the complete annual report
Please find page 215 of the 2010 General Motors annual report below. You can navigate through the pages in the report by either clicking on the pages listed below, or by using the keyword search tool below to find specific information within the annual report.-
 1
1 -
2
-
3
-
4
-
5
-
6
-
7
-
8
-
9
-
10
-
11
-
12
-
13
-
14
-
15
-
16
-
17
-
18
-
19
-
20
-
21
-
22
-
23
-
24
-
25
-
26
-
27
-
28
-
29
-
30
-
31
-
32
-
33
-
34
-
35
-
36
-
37
-
38
-
39
-
40
-
41
-
42
-
43
-
44
-
45
-
46
-
47
-
48
-
49
-
50
-
51
-
52
-
53
-
54
-
55
-
56
-
57
-
58
-
59
-
60
-
61
-
62
-
63
-
64
-
65
-
66
-
67
-
68
-
69
-
70
-
71
-
72
-
73
-
74
-
75
-
76
-
77
-
78
-
79
-
80
-
81
-
82
-
83
-
84
-
85
-
86
-
87
-
88
-
89
-
90
-
91
-
92
-
93
-
94
-
95
-
96
-
97
-
98
-
99
-
100
-
101
-
102
-
103
-
104
-
105
-
106
-
107
-
108
-
109
-
110
-
111
-
112
-
113
-
114
-
115
-
116
-
117
-
118
-
119
-
120
-
121
-
122
-
123
-
124
-
125
-
126
-
127
-
128
-
129
-
130
-
131
-
132
-
133
-
134
-
135
-
136
-
137
-
138
-
139
-
140
-
141
-
142
-
143
-
144
-
145
-
146
-
147
-
148
-
149
-
150
-
151
-
152
-
153
-
154
-
155
-
156
-
157
-
158
-
159
-
160
-
161
-
162
-
163
-
164
-
165
-
166
-
167
-
168
-
169
-
170
-
171
-
172
-
173
-
174
-
175
-
176
-
177
-
178
-
179
-
180
-
181
-
182
-
183
-
184
-
185
-
186
-
187
-
188
-
189
-
190
-
191
-
192
-
193
-
194
-
195
-
196
-
197
-
198
-
199
-
200
-
201
-
202
-
203
-
204
-
 205
205 -
 206
206 -
 207
207 -
 208
208 -
 209
209 -
 210
210 -
 211
211 -
 212
212 -
 213
213 -
 214
214 -
 215
215 -
 216
216 -
 217
217 -
 218
218 -
 219
219 -
 220
220 -
 221
221 -
 222
222 -
 223
223 -
 224
224 -
 225
225 -
226
-
227
-
228
-
229
-
230
-
231
-
232
-
233
-
234
-
235
-
236
-
237
-
238
-
239
-
240
-
241
-
242
-
243
-
244
-
245
-
246
-
247
-
248
-
249
-
250
-
251
-
252
-
253
-
254
-
255
-
256
-
257
-
258
-
259
-
260
-
261
-
262
-
263
-
264
-
265
-
266
-
267
-
268
-
269
-
270
-
271
-
272
-
273
-
274
-
275
-
276
-
277
-
278
-
279
-
280
-
281
-
282
-
283
-
284
-
285
-
286
-
287
-
288
-
289
-
290
 |
 |

GENERAL MOTORS COMPANY AND SUBSIDIARIES
NOTES TO CONSOLIDATED FINANCIAL STATEMENTS — (Continued)
securities rated below investment grade and believed to have similar risk characteristics. Credit arbitrage funds typically invest in a
variety of credit and credit-related instruments that allow fund managers to profit from mispricing of these credit instruments. Certain
derivatives may be used for hedging purposes by some fixed income fund managers to limit exposure to various risk factors.
Funds of hedge funds asset class includes funds that primarily invest in a portfolio of alternative investment funds. Funds of hedge
fund managers typically seek to achieve their objectives by allocating capital across a broad array of alternative investment funds and/
or investment managers.
Global macro funds asset class includes funds that primarily enter into leveraged transactions utilizing a variety of equity, fixed
income and derivative instruments to benefit from anticipated price movements of stock, interest rates, foreign exchange currencies,
and physical commodities markets while minimizing downside risk. Global macro managers employ a global approach and may
invest in a variety of markets to participate in expected market movements.
Multi-strategy funds asset class includes funds that invest in broadly diversified portfolios of equity, fixed income and derivative
instruments. Certain funds may also employ multiple alternative investment strategies, in combination, such as global macro, event-
driven (which seeks to profit from opportunities created by significant transactional events such as spin-offs, mergers and
acquisitions, bankruptcy reorganizations, recapitalizations and share buybacks), and relative value (which seeks to take advantage of
pricing discrepancies between instruments including equities, debt, options and futures).
Real estate funds asset class includes funds that primarily invest in entities which are principally engaged in the ownership, acquisition,
development, financing, sale and/or management of income-producing real estate properties, both commercial and residential. These funds
typically seek long-term growth of capital and current income that is above average relative to public equity funds.
Other investment funds generally consist of funds that employ broad-ranging strategies and styles. The objective of such funds is to
deliver returns having relatively low volatility and correlation to movements in major equity and bond markets. Funds in this category
typically employ single strategies such as event-driven or relative value.
Investment Trusts
A significant portion of the U.S. hourly and salaried pension plan assets are invested through a series of group trusts (Investment
Trusts) which permit the commingling of assets from more than one employer. The group trust structure permitted the formation of a
series of group trust investment accounts. Each group trust has a beneficial interest in the assets of the underlying investment accounts
which are invested to achieve an investment strategy based on the desired plan asset targeted allocations. For purposes of fair value
measurement, each plan’s interests in the group trusts are classified as a plan asset.
A plan’s interest in an Investment Trust is determined based on the Investment Trust’s beneficial interest in the underlying net
assets. Beneficial interests in the individual Investment Trusts owned by the plans were 99.0% and 97.4% on a combined basis at
December 31, 2010 and 2009.
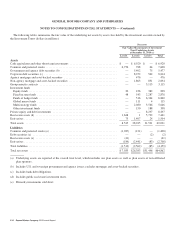
The following table summarizes the U.S. plans’ interest in certain net assets of the Investment Trusts (dollars in millions):
Successor
December 31, 2010 December 31, 2009
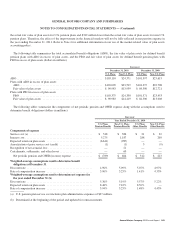
U.S. pension plans’ funded beneficial interest ......................................... $66,918 $53,043
OPEB 401(h) plans’ funded beneficial interest ........................................ — 3
Interests held in trusts by plans of other employers ..................................... 646 969
Total fair value of underlying assets of Investment Trusts ................................ 67,564 54,015
Less:
Cash ........................................................................ (2,828) (3,022)
Net non-security (assets) liabilities ................................................ 126 (323)
Net assets of the Investment Trusts .................................................. $64,862 $50,670
General Motors Company 2010 Annual Report 213