General Motors 2010 Annual Report Download - page 58
Download and view the complete annual report
Please find page 58 of the 2010 General Motors annual report below. You can navigate through the pages in the report by either clicking on the pages listed below, or by using the keyword search tool below to find specific information within the annual report.-
 1
1 -
2
-
3
-
4
-
5
-
6
-
7
-
8
-
9
-
10
-
11
-
12
-
13
-
14
-
15
-
16
-
17
-
18
-
19
-
20
-
21
-
22
-
23
-
24
-
25
-
26
-
27
-
28
-
29
-
30
-
31
-
32
-
33
-
34
-
35
-
36
-
37
-
38
-
39
-
40
-
41
-
42
-
43
-
44
-
45
-
46
-
47
-
 48
48 -
 49
49 -
 50
50 -
 51
51 -
 52
52 -
 53
53 -
 54
54 -
 55
55 -
 56
56 -
 57
57 -
 58
58 -
 59
59 -
 60
60 -
 61
61 -
 62
62 -
 63
63 -
 64
64 -
 65
65 -
 66
66 -
 67
67 -
 68
68 -
69
-
70
-
71
-
72
-
73
-
74
-
75
-
76
-
77
-
78
-
79
-
80
-
81
-
82
-
83
-
84
-
85
-
86
-
87
-
88
-
89
-
90
-
91
-
92
-
93
-
94
-
95
-
96
-
97
-
98
-
99
-
100
-
101
-
102
-
103
-
104
-
105
-
106
-
107
-
108
-
109
-
110
-
111
-
112
-
113
-
114
-
115
-
116
-
117
-
118
-
119
-
120
-
121
-
122
-
123
-
124
-
125
-
126
-
127
-
128
-
129
-
130
-
131
-
132
-
133
-
134
-
135
-
136
-
137
-
138
-
139
-
140
-
141
-
142
-
143
-
144
-
145
-
146
-
147
-
148
-
149
-
150
-
151
-
152
-
153
-
154
-
155
-
156
-
157
-
158
-
159
-
160
-
161
-
162
-
163
-
164
-
165
-
166
-
167
-
168
-
169
-
170
-
171
-
172
-
173
-
174
-
175
-
176
-
177
-
178
-
179
-
180
-
181
-
182
-
183
-
184
-
185
-
186
-
187
-
188
-
189
-
190
-
191
-
192
-
193
-
194
-
195
-
196
-
197
-
198
-
199
-
200
-
201
-
202
-
203
-
204
-
205
-
206
-
207
-
208
-
209
-
210
-
211
-
212
-
213
-
214
-
215
-
216
-
217
-
218
-
219
-
220
-
221
-
222
-
223
-
224
-
225
-
226
-
227
-
228
-
229
-
230
-
231
-
232
-
233
-
234
-
235
-
236
-
237
-
238
-
239
-
240
-
241
-
242
-
243
-
244
-
245
-
246
-
247
-
248
-
249
-
250
-
251
-
252
-
253
-
254
-
255
-
256
-
257
-
258
-
259
-
260
-
261
-
262
-
263
-
264
-
265
-
266
-
267
-
268
-
269
-
270
-
271
-
272
-
273
-
274
-
275
-
276
-
277
-
278
-
279
-
280
-
281
-
282
-
283
-
284
-
285
-
286
-
287
-
288
-
289
-
290
 |
 |
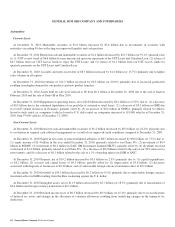
GENERAL MOTORS COMPANY AND SUBSIDIARIES
Automotive
Current Assets
At December 31, 2010 Marketable securities of $5.6 billion increased by $5.4 billion due to investments in securities with
maturities exceeding 90 days reflecting our improved liquidity and cash position.
At December 31, 2010 Restricted cash and marketable securities of $1.2 billion decreased by $12.7 billion (or 91.1%) primarily due
to: (1) UST escrow funds of $6.6 billion became unrestricted upon our repayment of the UST Loans and Canadian Loan; (2) release of
$4.7 billion from our UST escrow funds to repay the UST Loans; and (3) release of $1.2 billion from our UST escrow funds for
quarterly payments on the UST Loans and Canadian Loan.
At December 31, 2010 Accounts and notes receivable of $8.7 billion increased by $1.2 billion (or 15.7%) primarily due to higher
sales volumes in all regions.
At December 31, 2010 Inventories of $12.1 billion increased by $2.0 billion (or 20.0%) primarily due to increased production
resulting from higher demand for our products and new product launches.
At December 31, 2010 Assets held for sale were reduced to $0 from $0.4 billion at December 31, 2009 due to the sale of Saab in
February 2010 and the sale of Saab GB in May 2010.
At December 31, 2010 Equipment on operating leases, net of $2.6 billion decreased by $0.2 billion (or 5.8%) due to: (1) a decrease
of $0.3 billion due to the continued liquidation of our portfolio of automotive retail leases; (2) a decrease of $0.1 billion in GME due
to overall volume decreases in Germany; partially offset by (3) an increase of $0.2 billion in GMNA, primarily related to vehicles
leased to daily rental car companies (vehicles leased to U.S. daily rental car companies increased to 118,000 vehicles at December 31,
2010 from 97,000 vehicles at December 31, 2009).
Non-Current Assets
At December 31, 2010 Restricted cash and marketable securities of $1.2 billion decreased by $0.3 billion (or 22.1%) primarily due
to a reduction in required cash collateral arrangements as a result of our improved credit conditions compared to December 31, 2009.
At December 31, 2010 Equity in net assets of nonconsolidated affiliates of $8.5 billion increased by $0.6 billion (or 7.5%) due to:
(1) equity income of $1.4 billion in the year ended December 31, 2010, primarily related to our China JVs; (2) investment of $0.4
billion in SGMW; (3) investment of $0.2 billion in SAIC GM Investment Limited (HKJV); partially offset by (4) dividends received
or declared of $1.2 billion, primarily related to our China JVs; (5) a decrease of $0.2 billion related to the sale of our 50% interest in a
joint venture; and (6) a decrease of $0.1 billion related to the sale of a 1% ownership interest in SGM to SAIC.
At December 31, 2010 Property, net of $19.2 billion increased by $0.5 billion (or 2.9%) primarily due to: (1) capital expenditures,
of $4.2 billion; (2) accruals and capital leases of $0.5 billion; partially offset by (2) depreciation of $3.8 billion; (3) decreases
associated with disposals of businesses of $0.3 billion; and (4) unfavorable foreign currency translation effect of $0.1 billion.
At December 31, 2010 Goodwill of $30.5 billion decreased by $0.2 billion (or 0.5%) primarily due to unfavorable foreign currency
translation effect in GME resulting from the Euro weakening against the U.S. dollar.
At December 31, 2010 Intangible assets, net of $11.9 billion decreased by $2.7 billion (or 18.3%) primarily due to amortization of
$2.6 billion and foreign currency translation of $0.1 billion.
At December 31, 2010 Deferred income taxes of $0.3 billion decreased by $0.3 billion (or 45.4%) primarily due to reclassifications
of deferred tax assets and changes in the allocation of valuation allowances resulting from underlying changes in the timing of tax
deductions.
56 General Motors Company 2010 Annual Report