General Motors 2010 Annual Report Download - page 209
Download and view the complete annual report
Please find page 209 of the 2010 General Motors annual report below. You can navigate through the pages in the report by either clicking on the pages listed below, or by using the keyword search tool below to find specific information within the annual report.-
 1
1 -
2
-
3
-
4
-
5
-
6
-
7
-
8
-
9
-
10
-
11
-
12
-
13
-
14
-
15
-
16
-
17
-
18
-
19
-
20
-
21
-
22
-
23
-
24
-
25
-
26
-
27
-
28
-
29
-
30
-
31
-
32
-
33
-
34
-
35
-
36
-
37
-
38
-
39
-
40
-
41
-
42
-
43
-
44
-
45
-
46
-
47
-
48
-
49
-
50
-
51
-
52
-
53
-
54
-
55
-
56
-
57
-
58
-
59
-
60
-
61
-
62
-
63
-
64
-
65
-
66
-
67
-
68
-
69
-
70
-
71
-
72
-
73
-
74
-
75
-
76
-
77
-
78
-
79
-
80
-
81
-
82
-
83
-
84
-
85
-
86
-
87
-
88
-
89
-
90
-
91
-
92
-
93
-
94
-
95
-
96
-
97
-
98
-
99
-
100
-
101
-
102
-
103
-
104
-
105
-
106
-
107
-
108
-
109
-
110
-
111
-
112
-
113
-
114
-
115
-
116
-
117
-
118
-
119
-
120
-
121
-
122
-
123
-
124
-
125
-
126
-
127
-
128
-
129
-
130
-
131
-
132
-
133
-
134
-
135
-
136
-
137
-
138
-
139
-
140
-
141
-
142
-
143
-
144
-
145
-
146
-
147
-
148
-
149
-
150
-
151
-
152
-
153
-
154
-
155
-
156
-
157
-
158
-
159
-
160
-
161
-
162
-
163
-
164
-
165
-
166
-
167
-
168
-
169
-
170
-
171
-
172
-
173
-
174
-
175
-
176
-
177
-
178
-
179
-
180
-
181
-
182
-
183
-
184
-
185
-
186
-
187
-
188
-
189
-
190
-
191
-
192
-
193
-
194
-
195
-
196
-
197
-
198
-
 199
199 -
 200
200 -
 201
201 -
 202
202 -
 203
203 -
 204
204 -
 205
205 -
 206
206 -
 207
207 -
 208
208 -
 209
209 -
 210
210 -
 211
211 -
 212
212 -
 213
213 -
 214
214 -
 215
215 -
 216
216 -
 217
217 -
 218
218 -
 219
219 -
220
-
221
-
222
-
223
-
224
-
225
-
226
-
227
-
228
-
229
-
230
-
231
-
232
-
233
-
234
-
235
-
236
-
237
-
238
-
239
-
240
-
241
-
242
-
243
-
244
-
245
-
246
-
247
-
248
-
249
-
250
-
251
-
252
-
253
-
254
-
255
-
256
-
257
-
258
-
259
-
260
-
261
-
262
-
263
-
264
-
265
-
266
-
267
-
268
-
269
-
270
-
271
-
272
-
273
-
274
-
275
-
276
-
277
-
278
-
279
-
280
-
281
-
282
-
283
-
284
-
285
-
286
-
287
-
288
-
289
-
290
 |
 |

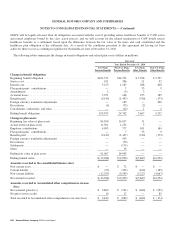
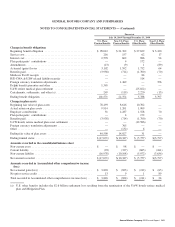
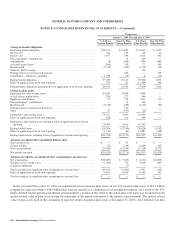
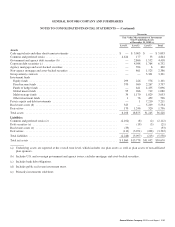
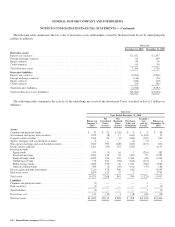
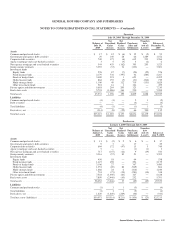
GENERAL MOTORS COMPANY AND SUBSIDIARIES
NOTES TO CONSOLIDATED FINANCIAL STATEMENTS — (Continued)
In setting a new strategic asset mix, consideration is given to the likelihood that the selected mix will effectively fund the projected
pension plan liabilities, while aligning with the risk tolerance of the plans’ fiduciaries. The strategic asset mix for U.S. defined benefit
pension plans is intended to reduce exposure to equity market risks, to utilize asset classes which reduce volatility and to utilize asset
classes where active management has historically generated above market returns.
In December 2010 an analysis of the investment policy was completed for the U.S. pension plans which reduced the expected
return on assets to 8.0% from 8.5% at December 31, 2009. The decrease in expected return on assets is primarily related to lower bond
yields and updated assumptions for equities and equity-like asset classes. This analysis included a study of capital market assumptions
and the selection of a policy portfolio that is optimal in the context of the plans’ fiduciaries objectives. The selected portfolio is
composed of a number of asset classes with favorable return characteristics including: a significant allocation to debt securities with
credit exposure, some of which have expected returns that are similar to that of equities, significant exposures to private market
securities (equity, debt, and real estate) and absolute return strategies (i.e., hedge fund strategies with low exposure to market risks).
The expected long-term rate of return assumption is enhanced by these diversified strategies and is consistent with the long-term
historical return for the U.S. plans.
The expected return on plan asset assumptions used in determining pension expense for non-U.S. pension plans is determined in a
similar manner to the U.S. plans, and the rate of 7.42% for the year ended December 31, 2010 is a weighted-average of all of the
funded non-U.S. plans.
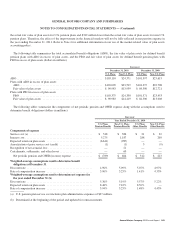
Target Allocation Percentages
Minor changes were made to the U.S. target allocation percentages by asset category as a result of the asset and liability study that
was approved in December 2010.
An asset and liability study conducted of the Canadian plans’ target allocation percentages was approved by GMCL’s Board of
Directors and became effective in July 2010. Significant changes were made to the target allocation percentages by asset category as a
result of this study. The study was generated following a contribution to the Canadian plans in September 2009 of CAD $4.0 billion
which improved the funded position. A less aggressive asset mix was implemented to preserve this position by shifting the target
allocation away from return seeking equity type assets toward a liability hedging strategy that utilizes more fixed income assets.
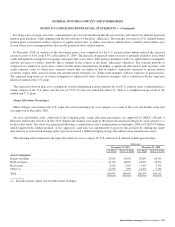
The following table summarizes the target allocations by asset category for U.S. and non-U.S. defined benefit pension plans:
Successor
December 31, 2010 December 31, 2009
U.S. Plans Non-U.S. Plans U.S. Plans Non-U.S. Plans
Asset Categories
Equity securities ................................................... 29.0% 36.0% 28.0% 64.0%
Debt securities ..................................................... 41.0% 48.0% 42.0% 24.0%
Real estate ........................................................ 8.0% 9.0% 9.0% 9.0%
Other (a) .......................................................... 22.0% 7.0% 21.0% 3.0%
Total ............................................................. 100.0% 100.0% 100.0% 100.0%
(a) Includes private equity and absolute return strategies.
General Motors Company 2010 Annual Report 207