General Motors 2010 Annual Report Download - page 213
Download and view the complete annual report
Please find page 213 of the 2010 General Motors annual report below. You can navigate through the pages in the report by either clicking on the pages listed below, or by using the keyword search tool below to find specific information within the annual report.-
 1
1 -
2
-
3
-
4
-
5
-
6
-
7
-
8
-
9
-
10
-
11
-
12
-
13
-
14
-
15
-
16
-
17
-
18
-
19
-
20
-
21
-
22
-
23
-
24
-
25
-
26
-
27
-
28
-
29
-
30
-
31
-
32
-
33
-
34
-
35
-
36
-
37
-
38
-
39
-
40
-
41
-
42
-
43
-
44
-
45
-
46
-
47
-
48
-
49
-
50
-
51
-
52
-
53
-
54
-
55
-
56
-
57
-
58
-
59
-
60
-
61
-
62
-
63
-
64
-
65
-
66
-
67
-
68
-
69
-
70
-
71
-
72
-
73
-
74
-
75
-
76
-
77
-
78
-
79
-
80
-
81
-
82
-
83
-
84
-
85
-
86
-
87
-
88
-
89
-
90
-
91
-
92
-
93
-
94
-
95
-
96
-
97
-
98
-
99
-
100
-
101
-
102
-
103
-
104
-
105
-
106
-
107
-
108
-
109
-
110
-
111
-
112
-
113
-
114
-
115
-
116
-
117
-
118
-
119
-
120
-
121
-
122
-
123
-
124
-
125
-
126
-
127
-
128
-
129
-
130
-
131
-
132
-
133
-
134
-
135
-
136
-
137
-
138
-
139
-
140
-
141
-
142
-
143
-
144
-
145
-
146
-
147
-
148
-
149
-
150
-
151
-
152
-
153
-
154
-
155
-
156
-
157
-
158
-
159
-
160
-
161
-
162
-
163
-
164
-
165
-
166
-
167
-
168
-
169
-
170
-
171
-
172
-
173
-
174
-
175
-
176
-
177
-
178
-
179
-
180
-
181
-
182
-
183
-
184
-
185
-
186
-
187
-
188
-
189
-
190
-
191
-
192
-
193
-
194
-
195
-
196
-
197
-
198
-
199
-
200
-
201
-
202
-
 203
203 -
 204
204 -
 205
205 -
 206
206 -
 207
207 -
 208
208 -
 209
209 -
 210
210 -
 211
211 -
 212
212 -
 213
213 -
 214
214 -
 215
215 -
 216
216 -
 217
217 -
 218
218 -
 219
219 -
 220
220 -
 221
221 -
 222
222 -
 223
223 -
224
-
225
-
226
-
227
-
228
-
229
-
230
-
231
-
232
-
233
-
234
-
235
-
236
-
237
-
238
-
239
-
240
-
241
-
242
-
243
-
244
-
245
-
246
-
247
-
248
-
249
-
250
-
251
-
252
-
253
-
254
-
255
-
256
-
257
-
258
-
259
-
260
-
261
-
262
-
263
-
264
-
265
-
266
-
267
-
268
-
269
-
270
-
271
-
272
-
273
-
274
-
275
-
276
-
277
-
278
-
279
-
280
-
281
-
282
-
283
-
284
-
285
-
286
-
287
-
288
-
289
-
290
 |
 |

GENERAL MOTORS COMPANY AND SUBSIDIARIES
NOTES TO CONSOLIDATED FINANCIAL STATEMENTS — (Continued)
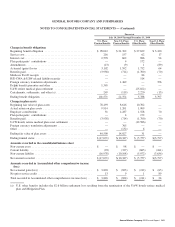
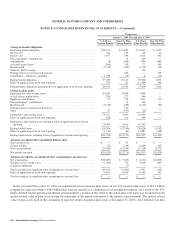
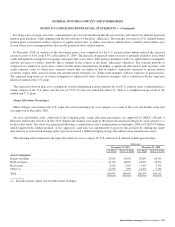
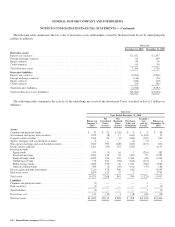
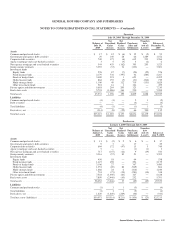
The following tables summarize the activity for non-U.S. plan assets classified in Level 3 (dollars in millions):
Successor
Year Ended December 31, 2010
Balance at
January 1,
2010
Net
Unrealized
Gains (Losses)
Net
Realized
Gains (Losses)
Purchases,
Sales and
Settlements
Transfers
into (out of)
Level 3
Exchange
Rate
Movements
Balance at
December 31,
2010
Direct investments
Government and agency debt
securities ...................... $ 65 $ 1 $ (3) $(13) $ (46) $ — $ 4
Corporate debt securities ............ 109 2 — (35) (38) 3 41
Agency mortgage and asset- backed
securities ...................... 7 — — — (7) — —
Non-agency mortgage and asset-backed
securities ...................... 16 10 (11) (5) (10) — —
Private equity and debt investments . . . 110 15 — 36 — 8 169
Real estate assets .................. 825 29 1 22 7 42 926
Total direct investments ............ 1,132 57 (13) 5 (94) 53 1,140
Investment funds
Equity funds ..................... 75 30 2 (72) 155 10 200
Real estate funds .................. 217 28 (1) 101 — (8) 337
Other investment funds ............. 95 44 — 68 212 13 432
Total investment funds ............. 387 102 1 97 367 15 969
Other investments ................. — 17 — (9) 253 20 281
Total non-U.S. plan assets ........... $1,519 $176 $(12) $ 93 $526 $ 88 $2,390
Successor
July 10, 2009 Through December 31, 2009
Balance at
July 10, 2009
Net
Unrealized
Gains (Losses)
Net
Realized
Gains (Losses)
Purchases,
Sales and
Settlements
Transfers
into (out of)
Level 3
Exchange
Rate
Movements
Balance at
December 31,
2009
Direct investments
Government and agency debt
securities ...................... $ 8 $ (1) $— $ 60 $ (3) $ 1 $ 65
Corporate debt securities ............ 17 6 1 37 43 5 109
Agency mortgage and asset-backed
securities ...................... 6 — — — 1 — 7
Non-agency mortgage and asset-backed
securities ...................... 10 19 (6) (11) 3 1 16
Private equity and debt investments . . . 149 (1) — (52) — 14 110
Real estate assets .................. 785 (52) — 11 — 81 825
Total direct investments ............ 975 (29) (5) 45 44 102 1,132
Investment funds
Equity funds ..................... 27 12 (9) 43 (2) 4 75
Real estate funds .................. 199 25 (2) (4) — (1) 217
Other investment funds ............. 107 3 1 (16) — — 95
Total investment funds ............. 333 40 (10) 23 (2) 3 387
Total non-U.S. plan assets ........... $1,308 $ 11 $(15) $ 68 $ 42 $105 $1,519
General Motors Company 2010 Annual Report 211