General Motors 2010 Annual Report Download - page 67
Download and view the complete annual report
Please find page 67 of the 2010 General Motors annual report below. You can navigate through the pages in the report by either clicking on the pages listed below, or by using the keyword search tool below to find specific information within the annual report.-
 1
1 -
2
-
3
-
4
-
5
-
6
-
7
-
8
-
9
-
10
-
11
-
12
-
13
-
14
-
15
-
16
-
17
-
18
-
19
-
20
-
21
-
22
-
23
-
24
-
25
-
26
-
27
-
28
-
29
-
30
-
31
-
32
-
33
-
34
-
35
-
36
-
37
-
38
-
39
-
40
-
41
-
42
-
43
-
44
-
45
-
46
-
47
-
48
-
49
-
50
-
51
-
52
-
53
-
54
-
55
-
56
-
 57
57 -
 58
58 -
 59
59 -
 60
60 -
 61
61 -
 62
62 -
 63
63 -
 64
64 -
 65
65 -
 66
66 -
 67
67 -
 68
68 -
 69
69 -
 70
70 -
 71
71 -
 72
72 -
 73
73 -
 74
74 -
 75
75 -
 76
76 -
 77
77 -
78
-
79
-
80
-
81
-
82
-
83
-
84
-
85
-
86
-
87
-
88
-
89
-
90
-
91
-
92
-
93
-
94
-
95
-
96
-
97
-
98
-
99
-
100
-
101
-
102
-
103
-
104
-
105
-
106
-
107
-
108
-
109
-
110
-
111
-
112
-
113
-
114
-
115
-
116
-
117
-
118
-
119
-
120
-
121
-
122
-
123
-
124
-
125
-
126
-
127
-
128
-
129
-
130
-
131
-
132
-
133
-
134
-
135
-
136
-
137
-
138
-
139
-
140
-
141
-
142
-
143
-
144
-
145
-
146
-
147
-
148
-
149
-
150
-
151
-
152
-
153
-
154
-
155
-
156
-
157
-
158
-
159
-
160
-
161
-
162
-
163
-
164
-
165
-
166
-
167
-
168
-
169
-
170
-
171
-
172
-
173
-
174
-
175
-
176
-
177
-
178
-
179
-
180
-
181
-
182
-
183
-
184
-
185
-
186
-
187
-
188
-
189
-
190
-
191
-
192
-
193
-
194
-
195
-
196
-
197
-
198
-
199
-
200
-
201
-
202
-
203
-
204
-
205
-
206
-
207
-
208
-
209
-
210
-
211
-
212
-
213
-
214
-
215
-
216
-
217
-
218
-
219
-
220
-
221
-
222
-
223
-
224
-
225
-
226
-
227
-
228
-
229
-
230
-
231
-
232
-
233
-
234
-
235
-
236
-
237
-
238
-
239
-
240
-
241
-
242
-
243
-
244
-
245
-
246
-
247
-
248
-
249
-
250
-
251
-
252
-
253
-
254
-
255
-
256
-
257
-
258
-
259
-
260
-
261
-
262
-
263
-
264
-
265
-
266
-
267
-
268
-
269
-
270
-
271
-
272
-
273
-
274
-
275
-
276
-
277
-
278
-
279
-
280
-
281
-
282
-
283
-
284
-
285
-
286
-
287
-
288
-
289
-
290
 |
 |

GENERAL MOTORS COMPANY AND SUBSIDIARIES
Year Ended
December 31, 2010
Year Ended
December 31, 2009
Year Ended
December 31, 2008
GM
GM
asa%of
Industry
Combined GM
and Old GM
Combined GM
and Old GM
asa%of
Industry Old GM
Old GM
asa%of
Industry
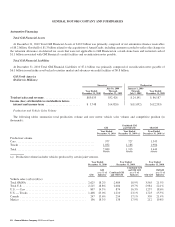
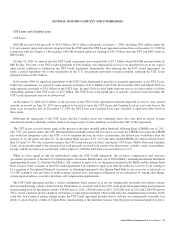
Vehicle sales (a)(b)(c)(d)(e)(f)
Total GMIO .......................................... 3,077 8.8% 2,453 8.7% 1,832 7.4%
Vehicle sales– consolidated entities .......................
Australia ............................................. 133 12.8% 121 12.9% 133 13.1%
Middle East Operations ................................. 123 10.7% 117 11.1% 144 9.3%
South Korea .......................................... 127 8.1% 115 7.9% 117 9.7%
Egypt ............................................... 68 27.2% 52 25.5% 60 23.1%
Vehicle sales–primarily joint ventures (f) ...................
China (g)(h) .......................................... 2,352 12.8% 1,826 13.3% 1,095 12.1%
India ................................................ 110 3.7% 69 3.1% 66 3.3%
(a) Vehicle sales primarily represent estimated sales to the ultimate customer. In countries where end customer data is not readily
available other data sources, such as wholesale volumes, are used to estimate vehicle sales.
(b) Includes HUMMER vehicle sales data.
(c) Vehicle sales data may include rounding differences.
(d) Our vehicle sales include Saab data through February 2010.
(e) Certain fleet sales that are accounted for as operating leases are included in vehicle sales at the time of delivery to the daily rental
car companies.
(f) The financial results (primarily Automotive sales and Automotive cost of sales) from Chevrolet brand products sold in GME are
primarily reported as part of GMIO. Chevrolet brand products included in GME vehicle sales volume and market share data was
477,000 vehicles in the year ended December 31, 2010. Combined GM and Old GM Chevrolet brand products included in GME
vehicle sales and market share data was 426,000 vehicles in the year ended December 31, 2009. Old GM Chevrolet brand
products included in GME vehicle sales and market share data was 510,000 vehicles in the year ended December 31, 2008.
Vehicle sales volume are reported in the geographical region they are sold.
(g) Includes SGM joint venture vehicle sales in China of 1.0 million vehicles, SGMW and FAW-GM joint venture vehicle sales in
China of 1.3 million vehicles and HKJV joint venture vehicle sales in India of 110,000 vehicles in the year ended December 31,
2010. Combined GM and Old GM SGM joint venture vehicle sales in China of 708,000 vehicles and combined GM and Old GM
SGMW and FAW-GM joint venture vehicle sales in China of 1.1 million vehicles in the year ended December 31, 2009. Old GM
SGM joint venture vehicle sales in China of 432,000 and Old GM SGMW joint venture vehicle sales in China of 647,000
vehicles in the year ended December 31, 2008. We do not record revenue from our joint ventures’ vehicle sales.
(h) The joint venture agreements with SGMW (44%) and FAW-GM (50%) allow for significant rights as a member as well as the
contractual right to report SGMW and FAW-GM joint venture vehicle sales in China as part of our global market share.
GMIO Total Net Sales and Revenue
(Dollars in Millions)
Successor
Combined GM
and Old GM Successor Predecessor
Year Ended
2010 vs. 2009
Change
Year Ended
2009 vs. 2008 Change
Year Ended
December 31, 2010
Year Ended
December 31, 2009
July 10, 2009
Through
December 31, 2009
January 1,
2009
Through
July 9, 2009
Year Ended
December 31
2008 Amount % Amount %
Total net sales and
revenue .......... $21,470 $14,785 $8,567 $6,218 $24,050 $6,685 45.2% $(9,265) 38.5%
General Motors Company 2010 Annual Report 65