General Motors 2010 Annual Report Download - page 62
Download and view the complete annual report
Please find page 62 of the 2010 General Motors annual report below. You can navigate through the pages in the report by either clicking on the pages listed below, or by using the keyword search tool below to find specific information within the annual report.-
 1
1 -
2
-
3
-
4
-
5
-
6
-
7
-
8
-
9
-
10
-
11
-
12
-
13
-
14
-
15
-
16
-
17
-
18
-
19
-
20
-
21
-
22
-
23
-
24
-
25
-
26
-
27
-
28
-
29
-
30
-
31
-
32
-
33
-
34
-
35
-
36
-
37
-
38
-
39
-
40
-
41
-
42
-
43
-
44
-
45
-
46
-
47
-
48
-
49
-
50
-
51
-
 52
52 -
 53
53 -
 54
54 -
 55
55 -
 56
56 -
 57
57 -
 58
58 -
 59
59 -
 60
60 -
 61
61 -
 62
62 -
 63
63 -
 64
64 -
 65
65 -
 66
66 -
 67
67 -
 68
68 -
 69
69 -
 70
70 -
 71
71 -
 72
72 -
73
-
74
-
75
-
76
-
77
-
78
-
79
-
80
-
81
-
82
-
83
-
84
-
85
-
86
-
87
-
88
-
89
-
90
-
91
-
92
-
93
-
94
-
95
-
96
-
97
-
98
-
99
-
100
-
101
-
102
-
103
-
104
-
105
-
106
-
107
-
108
-
109
-
110
-
111
-
112
-
113
-
114
-
115
-
116
-
117
-
118
-
119
-
120
-
121
-
122
-
123
-
124
-
125
-
126
-
127
-
128
-
129
-
130
-
131
-
132
-
133
-
134
-
135
-
136
-
137
-
138
-
139
-
140
-
141
-
142
-
143
-
144
-
145
-
146
-
147
-
148
-
149
-
150
-
151
-
152
-
153
-
154
-
155
-
156
-
157
-
158
-
159
-
160
-
161
-
162
-
163
-
164
-
165
-
166
-
167
-
168
-
169
-
170
-
171
-
172
-
173
-
174
-
175
-
176
-
177
-
178
-
179
-
180
-
181
-
182
-
183
-
184
-
185
-
186
-
187
-
188
-
189
-
190
-
191
-
192
-
193
-
194
-
195
-
196
-
197
-
198
-
199
-
200
-
201
-
202
-
203
-
204
-
205
-
206
-
207
-
208
-
209
-
210
-
211
-
212
-
213
-
214
-
215
-
216
-
217
-
218
-
219
-
220
-
221
-
222
-
223
-
224
-
225
-
226
-
227
-
228
-
229
-
230
-
231
-
232
-
233
-
234
-
235
-
236
-
237
-
238
-
239
-
240
-
241
-
242
-
243
-
244
-
245
-
246
-
247
-
248
-
249
-
250
-
251
-
252
-
253
-
254
-
255
-
256
-
257
-
258
-
259
-
260
-
261
-
262
-
263
-
264
-
265
-
266
-
267
-
268
-
269
-
270
-
271
-
272
-
273
-
274
-
275
-
276
-
277
-
278
-
279
-
280
-
281
-
282
-
283
-
284
-
285
-
286
-
287
-
288
-
289
-
290
 |
 |

GENERAL MOTORS COMPANY AND SUBSIDIARIES
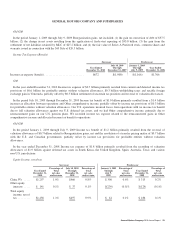
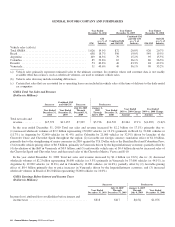
In the year ended December 31, 2010 Total net sales and revenue increased by $26.4 billion (or 46.7%) primarily due to:
(1) increased wholesale volumes of $19.8 billion representing 873,000 vehicles (or 42.7%) due to an improving economy and
successful recent vehicle launches of the Chevrolet Equinox, Chevrolet Cruze, GMC Terrain, Buick LaCrosse and Cadillac SRX;
(2) favorable pricing of $2.9 billion due to decreased sales allowances partially offset by less favorable adjustments in the U.S. to the
accrual for U.S. residual support programs for leased vehicles of $0.4 billion (favorable of $0.7 billion in 2010 compared to favorable
of $1.1 billion in 2009); (3) favorable vehicle mix of $1.6 billion due to increased crossover and truck sales; (4) increased sales of
$1.0 billion due to the acquisition of Nexteer and four domestic component manufacturing facilities; (5) favorable net foreign
currency remeasurement effect of $0.8 billion primarily driven by the strengthening of the Canadian Dollar against the U.S. Dollar;
and (6) increased revenues from OnStar of $0.3 billion primarily due to increased volumes.
In the year ended December 31, 2009 Total net sales and revenue decreased by $29.6 billion (or 34.3%) primarily due to:
(1) decreased revenue of $36.7 billion related to volume reductions; partially offset by (2) improved pricing, lower sales incentives
and improved lease residuals of $5.4 billion; and (3) favorable vehicle mix of $2.8 billion. The decrease in vehicle sales volumes was
primarily due to tight credit markets, increased unemployment rates and a recession in North America, Old GM’s well publicized
liquidity issues and Chapter 11 Proceedings; partially offset by improved vehicle sales related to the CARS program and an increase
in dealer showroom traffic and related vehicle sales in response to our new 60-Day satisfaction guarantee program.
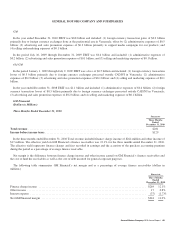
GMNA Earnings Before Interest and Income Taxes
(Dollars in Millions)
Successor Predecessor
Year Ended
December 31, 2010
July 10, 2009
Through
December 31, 2009
January 1, 2009
Through
July 9, 2009
Year Ended
December 31, 2008
Income (loss) attributable to stockholders before interest and
income taxes .................................... $5,748 $(4,820) $(11,092) $(12,203)
The most significant factors which influence GMNA’s profitability are industry volume (primarily U.S. seasonally adjusted annual
rate (SAAR)) and market share. While not as significant as industry volume and market share, another factor affecting GMNA
profitability is the relative mix of vehicles (cars, trucks, crossovers) sold. Contribution margin is a key indicator of product
profitability. Contribution margin is defined as revenue less material cost, freight, and policy and warranty expense. Vehicles with
higher selling prices generally have higher contribution margins. Trucks currently have a contribution margin of approximately 140%
of our portfolio on a weighted-average basis. Crossover vehicles’ contribution margins are in line with the overall portfolio on a
weighted-average basis, and cars are approximately 60% of the portfolio on a weighted-average basis. As such, a sudden shift in
consumer preference from trucks to cars would have an unfavorable effect on GMNA’s EBIT and breakeven point. For example, a
shift in demand such that industry market share for trucks deteriorated 10 percentage points and industry market share for cars
increased by 10 percentage points, holding other variables constant, would have increased GMNA’s breakeven point for the year
ended December 31, 2010, as measured in terms of GMNA factory unit sales, by 200,000 vehicles. For the year ended December 31,
2010 our U.S. car market share was 14.3% and our U.S. truck market share was 23.0%. We continue to strive to achieve a product
portfolio with more balanced contribution margins and less susceptibility to shifts in consumer demand.
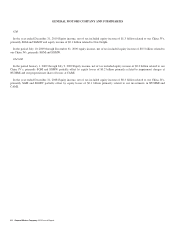
GM
In the year ended December 31, 2010 EBIT was $5.7 billion and included: (1) favorable adjustments of $0.4 billion to restructuring
reserves primarily due to increased production capacity utilization, which resulted in the recall of idled employees to fill added shifts
at multiple U.S. production sites and revisions to productivity initiatives; offset by (2) advertising and sales promotion expenses of
$3.4 billion primarily to support media campaigns for our products; (3) administrative expenses of $2.0 billion; (4) selling and
marketing expenses of $0.6 billion related to our dealerships; (5) foreign currency remeasurement losses of $0.5 billion primarily
driven by the strengthening of the Canadian Dollar against the U.S. Dollar; (6) charges of $0.2 billion for a recall campaign on
windshield fluid heaters; and (7) impairment charges related to product-specific tooling assets of $0.2 billion.
60 General Motors Company 2010 Annual Report