General Motors 2010 Annual Report Download - page 214
Download and view the complete annual report
Please find page 214 of the 2010 General Motors annual report below. You can navigate through the pages in the report by either clicking on the pages listed below, or by using the keyword search tool below to find specific information within the annual report.-
 1
1 -
2
-
3
-
4
-
5
-
6
-
7
-
8
-
9
-
10
-
11
-
12
-
13
-
14
-
15
-
16
-
17
-
18
-
19
-
20
-
21
-
22
-
23
-
24
-
25
-
26
-
27
-
28
-
29
-
30
-
31
-
32
-
33
-
34
-
35
-
36
-
37
-
38
-
39
-
40
-
41
-
42
-
43
-
44
-
45
-
46
-
47
-
48
-
49
-
50
-
51
-
52
-
53
-
54
-
55
-
56
-
57
-
58
-
59
-
60
-
61
-
62
-
63
-
64
-
65
-
66
-
67
-
68
-
69
-
70
-
71
-
72
-
73
-
74
-
75
-
76
-
77
-
78
-
79
-
80
-
81
-
82
-
83
-
84
-
85
-
86
-
87
-
88
-
89
-
90
-
91
-
92
-
93
-
94
-
95
-
96
-
97
-
98
-
99
-
100
-
101
-
102
-
103
-
104
-
105
-
106
-
107
-
108
-
109
-
110
-
111
-
112
-
113
-
114
-
115
-
116
-
117
-
118
-
119
-
120
-
121
-
122
-
123
-
124
-
125
-
126
-
127
-
128
-
129
-
130
-
131
-
132
-
133
-
134
-
135
-
136
-
137
-
138
-
139
-
140
-
141
-
142
-
143
-
144
-
145
-
146
-
147
-
148
-
149
-
150
-
151
-
152
-
153
-
154
-
155
-
156
-
157
-
158
-
159
-
160
-
161
-
162
-
163
-
164
-
165
-
166
-
167
-
168
-
169
-
170
-
171
-
172
-
173
-
174
-
175
-
176
-
177
-
178
-
179
-
180
-
181
-
182
-
183
-
184
-
185
-
186
-
187
-
188
-
189
-
190
-
191
-
192
-
193
-
194
-
195
-
196
-
197
-
198
-
199
-
200
-
201
-
202
-
203
-
 204
204 -
 205
205 -
 206
206 -
 207
207 -
 208
208 -
 209
209 -
 210
210 -
 211
211 -
 212
212 -
 213
213 -
 214
214 -
 215
215 -
 216
216 -
 217
217 -
 218
218 -
 219
219 -
 220
220 -
 221
221 -
 222
222 -
 223
223 -
 224
224 -
225
-
226
-
227
-
228
-
229
-
230
-
231
-
232
-
233
-
234
-
235
-
236
-
237
-
238
-
239
-
240
-
241
-
242
-
243
-
244
-
245
-
246
-
247
-
248
-
249
-
250
-
251
-
252
-
253
-
254
-
255
-
256
-
257
-
258
-
259
-
260
-
261
-
262
-
263
-
264
-
265
-
266
-
267
-
268
-
269
-
270
-
271
-
272
-
273
-
274
-
275
-
276
-
277
-
278
-
279
-
280
-
281
-
282
-
283
-
284
-
285
-
286
-
287
-
288
-
289
-
290
 |
 |

GENERAL MOTORS COMPANY AND SUBSIDIARIES
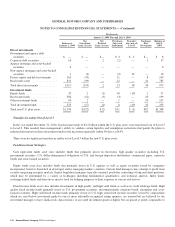
NOTES TO CONSOLIDATED FINANCIAL STATEMENTS — (Continued)
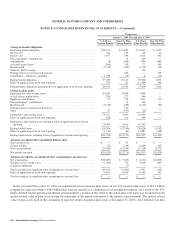
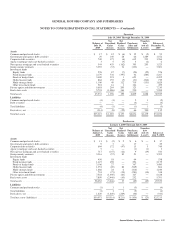
Predecessor
January 1, 2009 Through July 9, 2009
Balance at
January 1, 2009
Net
Unrealized
Gains (Losses)
Net
Realized
Gains (Losses)
Purchases,
Sales and
Settlements
Transfers
into (out of)
Level 3
Exchange
Rate
Movements
Balance at
July 9,
2009
Direct investments
Government and agency debt
securities ...................... $ — $ — $— $ 4 $ 4 $— $ 8
Corporate debt securities ............ 16 — 2 (2) — 1 17
Agency mortgage and asset-backed
securities ...................... 6 — — — — — 6
Non-agency mortgage and asset-backed
securities ...................... 1 (3) — (2) 14 — 10
Private equity and debt investments . . . 163 (33) — 11 — 8 149
Real estate assets .................. 831 (99) — 12 — 41 785
Total direct investments ............ 1,017 (135) 2 23 18 50 975
Investment funds
Equity funds ...................... 33 2 (1) 10 (19) 2 27
Real estate funds .................. 206 (21) (3) (3) — 20 199
Other investment funds ............. 94 2 — 1 — 10 107
Total investment funds ............. 333 (17) (4) 8 (19) 32 333
Total non-U.S. plan assets ........... $1,350 $(152) $ (2) $31 $ (1) $82 $1,308
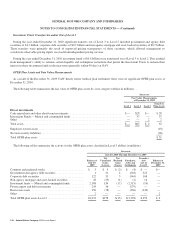
Transfers In and/or Out of Level 3
In the year ended December 31, 2010, fixed income funds of $4.2 billion within the U.S. plan assets were transferred out of Level 3
to Level 2. This resulted from management’s ability to validate certain liquidity and redemption restrictions that permit the plans to
redeem their interest in these investment funds in the near-term (generally within 90 days) at NAV.
There were no significant transfers in and/or out of Level 3 within the non-U.S. plan assets.
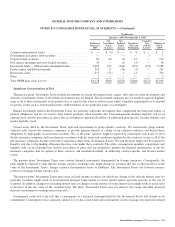
Fund Investment Strategies
Cash equivalent funds asset class includes funds that primarily invest in short-term, high quality securities including U.S.
government securities, U.S. dollar-denominated obligations of U.S. and foreign depository institutions, commercial paper, corporate
bonds and asset-backed securities.
Equity funds asset class includes funds that primarily invest in U.S. equities as well as equity securities issued by companies
incorporated, listed or domiciled in developed and/or emerging markets countries. Certain fund managers may attempt to profit from
security mispricing in equity markets. Equity long/short managers typically construct portfolios consisting of long and short positions,
which may be determined by a variety of techniques including fundamental, quantitative, and technical analysis. Index funds,
exchange traded funds and derivatives may be used for hedging purposes to limit exposure to various risk factors.
Fixed income funds asset class includes investments in high quality and high yield funds as well as in credit arbitrage funds. High
quality fixed income funds primarily invest in U.S. government securities, investment-grade corporate bonds, mortgages and asset-
backed securities. High yield fixed income funds primarily invest in U.S. high yield fixed income securities issued by corporations
which are rated below investment grade by one or more nationally recognized rating agencies, are unrated but are believed by the
investment manager to have similar risk characteristics or are rated investment grade or higher but are priced at yields comparable to
212 General Motors Company 2010 Annual Report