General Motors 2010 Annual Report Download - page 57
Download and view the complete annual report
Please find page 57 of the 2010 General Motors annual report below. You can navigate through the pages in the report by either clicking on the pages listed below, or by using the keyword search tool below to find specific information within the annual report.-
 1
1 -
2
-
3
-
4
-
5
-
6
-
7
-
8
-
9
-
10
-
11
-
12
-
13
-
14
-
15
-
16
-
17
-
18
-
19
-
20
-
21
-
22
-
23
-
24
-
25
-
26
-
27
-
28
-
29
-
30
-
31
-
32
-
33
-
34
-
35
-
36
-
37
-
38
-
39
-
40
-
41
-
42
-
43
-
44
-
45
-
46
-
 47
47 -
 48
48 -
 49
49 -
 50
50 -
 51
51 -
 52
52 -
 53
53 -
 54
54 -
 55
55 -
 56
56 -
 57
57 -
 58
58 -
 59
59 -
 60
60 -
 61
61 -
 62
62 -
 63
63 -
 64
64 -
 65
65 -
 66
66 -
 67
67 -
68
-
69
-
70
-
71
-
72
-
73
-
74
-
75
-
76
-
77
-
78
-
79
-
80
-
81
-
82
-
83
-
84
-
85
-
86
-
87
-
88
-
89
-
90
-
91
-
92
-
93
-
94
-
95
-
96
-
97
-
98
-
99
-
100
-
101
-
102
-
103
-
104
-
105
-
106
-
107
-
108
-
109
-
110
-
111
-
112
-
113
-
114
-
115
-
116
-
117
-
118
-
119
-
120
-
121
-
122
-
123
-
124
-
125
-
126
-
127
-
128
-
129
-
130
-
131
-
132
-
133
-
134
-
135
-
136
-
137
-
138
-
139
-
140
-
141
-
142
-
143
-
144
-
145
-
146
-
147
-
148
-
149
-
150
-
151
-
152
-
153
-
154
-
155
-
156
-
157
-
158
-
159
-
160
-
161
-
162
-
163
-
164
-
165
-
166
-
167
-
168
-
169
-
170
-
171
-
172
-
173
-
174
-
175
-
176
-
177
-
178
-
179
-
180
-
181
-
182
-
183
-
184
-
185
-
186
-
187
-
188
-
189
-
190
-
191
-
192
-
193
-
194
-
195
-
196
-
197
-
198
-
199
-
200
-
201
-
202
-
203
-
204
-
205
-
206
-
207
-
208
-
209
-
210
-
211
-
212
-
213
-
214
-
215
-
216
-
217
-
218
-
219
-
220
-
221
-
222
-
223
-
224
-
225
-
226
-
227
-
228
-
229
-
230
-
231
-
232
-
233
-
234
-
235
-
236
-
237
-
238
-
239
-
240
-
241
-
242
-
243
-
244
-
245
-
246
-
247
-
248
-
249
-
250
-
251
-
252
-
253
-
254
-
255
-
256
-
257
-
258
-
259
-
260
-
261
-
262
-
263
-
264
-
265
-
266
-
267
-
268
-
269
-
270
-
271
-
272
-
273
-
274
-
275
-
276
-
277
-
278
-
279
-
280
-
281
-
282
-
283
-
284
-
285
-
286
-
287
-
288
-
289
-
290
 |
 |

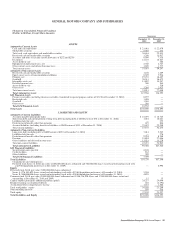
GENERAL MOTORS COMPANY AND SUBSIDIARIES
Changes in Consolidated Financial Condition
(Dollars in Millions, Except Share Amounts)
Successor
December 31,
2010
December 31,
2009
ASSETS
Automotive Current Assets
Cash and cash equivalents ...................................................................................... $ 21,061 $ 22,679
Marketable securities .......................................................................................... 5,555 134
Total cash, cash equivalents and marketable securities ................................................................ 26,616 22,813
Restricted cash and marketable securities .......................................................................... 1,240 13,917
Accounts and notes receivable (net of allowance of $252 and $250) ..................................................... 8,699 7,518
Inventories .................................................................................................. 12,125 10,107
Assets held for sale ............................................................................................ — 388
Equipment on operating leases, net ............................................................................... 2,568 2,727
Other current assets and deferred income taxes ...................................................................... 1,805 1,777
Total current assets ............................................................................................ 53,053 59,247
Automotive Non-current Assets
Restricted cash and marketable securities .......................................................................... 1,160 1,489
Equity in net assets of nonconsolidated affiliates .................................................................... 8,529 7,936
Property, net ................................................................................................. 19,235 18,687
Goodwill .................................................................................................... 30,513 30,672
Intangible assets, net .......................................................................................... 11,882 14,547
Deferred income taxes ......................................................................................... 308 564
Assets held for sale ............................................................................................ — 530
Other assets ................................................................................................. 3,286 2,623
Total non-current assets ........................................................................................ 74,913 77,048
Total Automotive Assets ...................................................................................... 127,966 136,295
GM Financial Assets
Finance receivables (including finance receivables transferred to special purpose entities of $7,156 at December 31, 2010) ......... 8,197 —
Restricted cash ............................................................................................... 1,090 —
Goodwill .................................................................................................... 1,265 —
Other assets ................................................................................................. 380 —
Total GM Financial Assets .................................................................................... 10,932 —
Total Assets ................................................................................................... $138,898 $136,295
LIABILITIES AND EQUITY
Automotive Current Liabilities
Accounts payable (principally trade) .............................................................................. $ 21,497 $ 18,725
Short-term debt and current portion of long-term debt (including debt at GM Daewoo of $70 at December 31, 2010) .............. 1,616 10,221
Liabilities held for sale ......................................................................................... — 355
Postretirement benefits other than pensions ......................................................................... 625 846
Accrued liabilities (including derivative liabilities at GM Daewoo of $111 at December 31, 2010) ............................. 23,419 22,288
Total current liabilities ......................................................................................... 47,157 52,435
Automotive Non-current Liabilities
Long-term debt (including debt at GM Daewoo of $835 at December 31, 2010) ............................................ 3,014 5,562
Liabilities held for sale ......................................................................................... — 270
Postretirement benefits other than pensions ......................................................................... 9,294 8,708
Pensions .................................................................................................... 21,894 27,086
Other liabilities and deferred income taxes ......................................................................... 13,021 13,279
Total non-current liabilities ..................................................................................... 47,223 54,905
Total Automotive Liabilities ................................................................................... 94,380 107,340
GM Financial Liabilities
Securitization notes payable ..................................................................................... 6,128 —
Credit facilities ............................................................................................... 832 —
Other liabilities ............................................................................................... 399 —
Total GM Financial Liabilities ................................................................................. 7,359 —
Total Liabilities ................................................................................................ 101,739 107,340
Commitments and contingencies .................................................................................
Preferred stock Series A, $0.01 par value (2,000,000,000 shares authorized and 360,000,000 shares issued and outstanding (each with
a $25.00 liquidation preference) at December 31, 2009) ............................................................. — 6,998
Equity
Preferred stock, $0.01 par value, 2,000,000,000 shares authorized:
Series A (276,101,695 shares issued and outstanding (each with a $25.00 liquidation preference) at December 31, 2010) ........... 5,536 —
Series B (100,000,000 shares issued and outstanding (each with a $50.00 liquidation preference) at December 31, 2010) ........... 4,855 —
Common stock, $0.01 par value (5,000,000,000 shares authorized and 1,500,136,998 shares and 1,500,000,000 shares issued and
outstanding at December 31, 2010 and 2009) ....................................................................... 15 15
Capital surplus (principally additional paid-in capital) .................................................................. 24,257 24,040
Retained earnings (accumulated deficit) ............................................................................. 266 (4,394)
Accumulated other comprehensive income ........................................................................... 1,251 1,588
Total stockholders’ equity ........................................................................................ 36,180 21,249
Noncontrolling interests .......................................................................................... 979 708
Total equity ................................................................................................... 37,159 21,957
Total Liabilities and Equity ...................................................................................... $138,898 $136,295
General Motors Company 2010 Annual Report 55