General Motors 2010 Annual Report Download - page 132
Download and view the complete annual report
Please find page 132 of the 2010 General Motors annual report below. You can navigate through the pages in the report by either clicking on the pages listed below, or by using the keyword search tool below to find specific information within the annual report.-
 1
1 -
2
-
3
-
4
-
5
-
6
-
7
-
8
-
9
-
10
-
11
-
12
-
13
-
14
-
15
-
16
-
17
-
18
-
19
-
20
-
21
-
22
-
23
-
24
-
25
-
26
-
27
-
28
-
29
-
30
-
31
-
32
-
33
-
34
-
35
-
36
-
37
-
38
-
39
-
40
-
41
-
42
-
43
-
44
-
45
-
46
-
47
-
48
-
49
-
50
-
51
-
52
-
53
-
54
-
55
-
56
-
57
-
58
-
59
-
60
-
61
-
62
-
63
-
64
-
65
-
66
-
67
-
68
-
69
-
70
-
71
-
72
-
73
-
74
-
75
-
76
-
77
-
78
-
79
-
80
-
81
-
82
-
83
-
84
-
85
-
86
-
87
-
88
-
89
-
90
-
91
-
92
-
93
-
94
-
95
-
96
-
97
-
98
-
99
-
100
-
101
-
102
-
103
-
104
-
105
-
106
-
107
-
108
-
109
-
110
-
111
-
112
-
113
-
114
-
115
-
116
-
117
-
118
-
119
-
120
-
121
-
 122
122 -
 123
123 -
 124
124 -
 125
125 -
 126
126 -
 127
127 -
 128
128 -
 129
129 -
 130
130 -
 131
131 -
 132
132 -
 133
133 -
 134
134 -
 135
135 -
 136
136 -
 137
137 -
 138
138 -
 139
139 -
 140
140 -
 141
141 -
 142
142 -
143
-
144
-
145
-
146
-
147
-
148
-
149
-
150
-
151
-
152
-
153
-
154
-
155
-
156
-
157
-
158
-
159
-
160
-
161
-
162
-
163
-
164
-
165
-
166
-
167
-
168
-
169
-
170
-
171
-
172
-
173
-
174
-
175
-
176
-
177
-
178
-
179
-
180
-
181
-
182
-
183
-
184
-
185
-
186
-
187
-
188
-
189
-
190
-
191
-
192
-
193
-
194
-
195
-
196
-
197
-
198
-
199
-
200
-
201
-
202
-
203
-
204
-
205
-
206
-
207
-
208
-
209
-
210
-
211
-
212
-
213
-
214
-
215
-
216
-
217
-
218
-
219
-
220
-
221
-
222
-
223
-
224
-
225
-
226
-
227
-
228
-
229
-
230
-
231
-
232
-
233
-
234
-
235
-
236
-
237
-
238
-
239
-
240
-
241
-
242
-
243
-
244
-
245
-
246
-
247
-
248
-
249
-
250
-
251
-
252
-
253
-
254
-
255
-
256
-
257
-
258
-
259
-
260
-
261
-
262
-
263
-
264
-
265
-
266
-
267
-
268
-
269
-
270
-
271
-
272
-
273
-
274
-
275
-
276
-
277
-
278
-
279
-
280
-
281
-
282
-
283
-
284
-
285
-
286
-
287
-
288
-
289
-
290
 |
 |
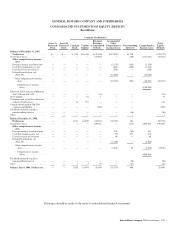
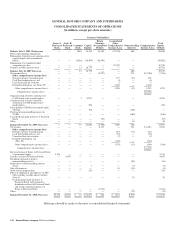
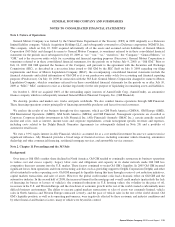
GENERAL MOTORS COMPANY AND SUBSIDIARIES
NOTES TO CONSOLIDATED FINANCIAL STATEMENTS — (Continued)
• The amount of cash we maintained at July 10, 2009 that we determined to be in excess of the amount necessary to conduct our
normal business activities.
The sum of the first, third and fourth bullet items equals our Enterprise value.
Our discounted forecast of expected future cash flows included:
• Forecasted cash flows for the six months ended December 31, 2009 and the years ending December 31, 2010 through 2014,
for each of Old GM’s former segments including GMNA, GME, GM Latin America/Africa/Middle East (GMLAAM) and GM
Asia Pacific (GMAP) and for certain subsidiaries that incorporated:
• Industry seasonally adjusted annual rate (SAAR) of vehicle sales and our related market share based on vehicle sales
volumes as follows:
• Worldwide — 59.1 million vehicles and market share of 11.9% in 2010 increasing to 81.0 million vehicles and
market share of 12.2% in 2014;
• North America — 14.2 million vehicles and market share of 17.8% in 2010 increasing to 19.8 million vehicles and
decreasing market share of 17.6% in 2014;
• Europe — 16.8 million vehicles and market share of 9.5% in 2010 increasing to 22.5 million vehicles and market
share of 10.3% in 2014;
• LAAM — 6.1 million vehicles and market share of 18.0% in 2010 increasing to 7.8 million vehicles and market
share of 18.4% in 2014; and
• AP — 22.0 million vehicles and market share of 8.4% in 2010 increasing to 30.8 million vehicles and market share
of 8.6% in 2014.
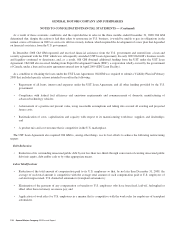
• Projected product mix, which incorporates the 2010 introductions of the Chevrolet Volt, Chevrolet/Holden Cruze,
Cadillac CTS Coupe, Opel/Vauxhall Meriva and Opel/Vauxhall Astra Station Wagon;
• Projected changes in our cost structure due to restructuring initiatives that encompass reduction of hourly and salaried
employment levels by approximately 18,000;
• The terms of the 2009 UAW Retiree Settlement Agreement, which released us from UAW retiree healthcare claims
incurred after December 31, 2009;
• Projected capital spending to support existing and future products, which range from $4.9 billion in 2010 to $6.0 billion
in 2014; and
• Anticipated changes in global market conditions.
• A terminal value, which was determined using a growth model that applied long-term growth rates ranging from 0.5% to 6.0%
and a weighted-average long-term growth rate of 2.6% to our projected cash flows beyond 2014. The long-term growth rates
were based on our internal projections as well as industry growth prospects; and
• Discount rates that considered various factors including bond yields, risk premiums, and tax rates to determine a weighted-
average cost of capital (WACC), which measures a company’s cost of debt and equity weighted by the percentage of debt and
equity in a company’s target capital structure. We used discount rates ranging from 16.5% to 23.5% and a weighted-average
rate of 22.8%.
130 General Motors Company 2010 Annual Report