General Motors 2010 Annual Report Download - page 96
Download and view the complete annual report
Please find page 96 of the 2010 General Motors annual report below. You can navigate through the pages in the report by either clicking on the pages listed below, or by using the keyword search tool below to find specific information within the annual report.-
 1
1 -
2
-
3
-
4
-
5
-
6
-
7
-
8
-
9
-
10
-
11
-
12
-
13
-
14
-
15
-
16
-
17
-
18
-
19
-
20
-
21
-
22
-
23
-
24
-
25
-
26
-
27
-
28
-
29
-
30
-
31
-
32
-
33
-
34
-
35
-
36
-
37
-
38
-
39
-
40
-
41
-
42
-
43
-
44
-
45
-
46
-
47
-
48
-
49
-
50
-
51
-
52
-
53
-
54
-
55
-
56
-
57
-
58
-
59
-
60
-
61
-
62
-
63
-
64
-
65
-
66
-
67
-
68
-
69
-
70
-
71
-
72
-
73
-
74
-
75
-
76
-
77
-
78
-
79
-
80
-
81
-
82
-
83
-
84
-
85
-
 86
86 -
 87
87 -
 88
88 -
 89
89 -
 90
90 -
 91
91 -
 92
92 -
 93
93 -
 94
94 -
 95
95 -
 96
96 -
 97
97 -
 98
98 -
 99
99 -
 100
100 -
 101
101 -
 102
102 -
 103
103 -
 104
104 -
 105
105 -
 106
106 -
107
-
108
-
109
-
110
-
111
-
112
-
113
-
114
-
115
-
116
-
117
-
118
-
119
-
120
-
121
-
122
-
123
-
124
-
125
-
126
-
127
-
128
-
129
-
130
-
131
-
132
-
133
-
134
-
135
-
136
-
137
-
138
-
139
-
140
-
141
-
142
-
143
-
144
-
145
-
146
-
147
-
148
-
149
-
150
-
151
-
152
-
153
-
154
-
155
-
156
-
157
-
158
-
159
-
160
-
161
-
162
-
163
-
164
-
165
-
166
-
167
-
168
-
169
-
170
-
171
-
172
-
173
-
174
-
175
-
176
-
177
-
178
-
179
-
180
-
181
-
182
-
183
-
184
-
185
-
186
-
187
-
188
-
189
-
190
-
191
-
192
-
193
-
194
-
195
-
196
-
197
-
198
-
199
-
200
-
201
-
202
-
203
-
204
-
205
-
206
-
207
-
208
-
209
-
210
-
211
-
212
-
213
-
214
-
215
-
216
-
217
-
218
-
219
-
220
-
221
-
222
-
223
-
224
-
225
-
226
-
227
-
228
-
229
-
230
-
231
-
232
-
233
-
234
-
235
-
236
-
237
-
238
-
239
-
240
-
241
-
242
-
243
-
244
-
245
-
246
-
247
-
248
-
249
-
250
-
251
-
252
-
253
-
254
-
255
-
256
-
257
-
258
-
259
-
260
-
261
-
262
-
263
-
264
-
265
-
266
-
267
-
268
-
269
-
270
-
271
-
272
-
273
-
274
-
275
-
276
-
277
-
278
-
279
-
280
-
281
-
282
-
283
-
284
-
285
-
286
-
287
-
288
-
289
-
290
 |
 |
GENERAL MOTORS COMPANY AND SUBSIDIARIES
Our discounted forecast of expected future cash flows included:
• Forecasted cash flows for the six months ended December 31, 2009 and the years ending December 31, 2010 through 2014,
for each of Old GM’s former segments including GMNA, GME, GM Latin America/Africa/Middle East (GMLAAM) and GM
Asia Pacific (GMAP) and for certain subsidiaries that incorporated:
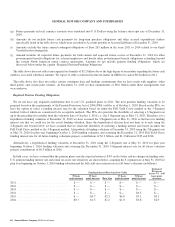
• Industry SAAR of vehicle sales and our related market share as follows:
• Worldwide — 59.1 million vehicles and market share of 11.9% in 2010 increasing to 81.0 million vehicles and
market share of 12.2% in 2014;
• North America — 14.2 million vehicles and market share of 17.8% in 2010 increasing to 19.8 million vehicles and
decreasing market share of 17.6% in 2014;
• Europe — 16.8 million vehicles and market share of 9.5% in 2010 increasing to 22.5 million vehicles and market
share of 10.3% in 2014;
• LAAM — 6.1 million vehicles and market share of 18.0% in 2010 increasing to 7.8 million vehicles and market
share of 18.4% in 2014; and
• AP — 22.0 million vehicles and market share of 8.4% in 2010 increasing to 30.8 million vehicles and market share
of 8.6% in 2014.
• Projected product mix, which incorporates the 2010 introductions of the Chevrolet Volt, Chevrolet/Holden Cruze,
Cadillac CTS Coupe, Opel/Vauxhall Meriva and Opel/Vauxhall Astra Station Wagon;
• Projected changes in our cost structure due to restructuring initiatives that encompass reduction of hourly and salaried
employment levels by approximately 18,000;
• The terms of the 2009 UAW Retiree Settlement Agreement, which released us from UAW retiree healthcare claims
incurred after December 31, 2009;
• Projected capital spending to support existing and future products, which range from $4.9 billion in 2010 to $6.0 billion
in 2014; and
• Anticipated changes in global market conditions.
• A terminal value, which was determined using a growth model that applied long-term growth rates ranging from 0.5% to 6.0%
and a weighted-average long-term growth rate of 2.6% to our projected cash flows beyond 2014. The long-term growth rates
were based on our internal projections as well as industry growth prospects; and
• Discount rates that considered various factors including bond yields, risk premiums, and tax rates to determine a weighted-
average cost of capital (WACC), which measures a company’s cost of debt and equity weighted by the percentage of debt and
equity in a company’s target capital structure. We used discount rates ranging from 16.5% to 23.5% and a weighted-average
rate of 22.8%.
To estimate the value of our investment in nonconsolidated affiliates we used multiple valuation techniques, but we primarily used
discounted cash flow analysis. Our excess cash of $33.8 billion, including Restricted cash and marketable securities of $21.2 billion,
represents cash in excess of the amount necessary to conduct our ongoing day-to-day business activities and to keep them running as a
going concern. Refer to Note 15 to our consolidated financial statements for additional discussion of Restricted cash and marketable
securities.
94 General Motors Company 2010 Annual Report