General Motors 2010 Annual Report Download - page 175
Download and view the complete annual report
Please find page 175 of the 2010 General Motors annual report below. You can navigate through the pages in the report by either clicking on the pages listed below, or by using the keyword search tool below to find specific information within the annual report.-
 1
1 -
2
-
3
-
4
-
5
-
6
-
7
-
8
-
9
-
10
-
11
-
12
-
13
-
14
-
15
-
16
-
17
-
18
-
19
-
20
-
21
-
22
-
23
-
24
-
25
-
26
-
27
-
28
-
29
-
30
-
31
-
32
-
33
-
34
-
35
-
36
-
37
-
38
-
39
-
40
-
41
-
42
-
43
-
44
-
45
-
46
-
47
-
48
-
49
-
50
-
51
-
52
-
53
-
54
-
55
-
56
-
57
-
58
-
59
-
60
-
61
-
62
-
63
-
64
-
65
-
66
-
67
-
68
-
69
-
70
-
71
-
72
-
73
-
74
-
75
-
76
-
77
-
78
-
79
-
80
-
81
-
82
-
83
-
84
-
85
-
86
-
87
-
88
-
89
-
90
-
91
-
92
-
93
-
94
-
95
-
96
-
97
-
98
-
99
-
100
-
101
-
102
-
103
-
104
-
105
-
106
-
107
-
108
-
109
-
110
-
111
-
112
-
113
-
114
-
115
-
116
-
117
-
118
-
119
-
120
-
121
-
122
-
123
-
124
-
125
-
126
-
127
-
128
-
129
-
130
-
131
-
132
-
133
-
134
-
135
-
136
-
137
-
138
-
139
-
140
-
141
-
142
-
143
-
144
-
145
-
146
-
147
-
148
-
149
-
150
-
151
-
152
-
153
-
154
-
155
-
156
-
157
-
158
-
159
-
160
-
161
-
162
-
163
-
164
-
 165
165 -
 166
166 -
 167
167 -
 168
168 -
 169
169 -
 170
170 -
 171
171 -
 172
172 -
 173
173 -
 174
174 -
 175
175 -
 176
176 -
 177
177 -
 178
178 -
 179
179 -
 180
180 -
 181
181 -
 182
182 -
 183
183 -
 184
184 -
 185
185 -
186
-
187
-
188
-
189
-
190
-
191
-
192
-
193
-
194
-
195
-
196
-
197
-
198
-
199
-
200
-
201
-
202
-
203
-
204
-
205
-
206
-
207
-
208
-
209
-
210
-
211
-
212
-
213
-
214
-
215
-
216
-
217
-
218
-
219
-
220
-
221
-
222
-
223
-
224
-
225
-
226
-
227
-
228
-
229
-
230
-
231
-
232
-
233
-
234
-
235
-
236
-
237
-
238
-
239
-
240
-
241
-
242
-
243
-
244
-
245
-
246
-
247
-
248
-
249
-
250
-
251
-
252
-
253
-
254
-
255
-
256
-
257
-
258
-
259
-
260
-
261
-
262
-
263
-
264
-
265
-
266
-
267
-
268
-
269
-
270
-
271
-
272
-
273
-
274
-
275
-
276
-
277
-
278
-
279
-
280
-
281
-
282
-
283
-
284
-
285
-
286
-
287
-
288
-
289
-
290
 |
 |

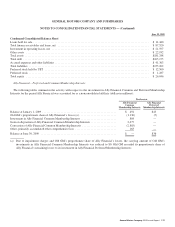
GENERAL MOTORS COMPANY AND SUBSIDIARIES
NOTES TO CONSOLIDATED FINANCIAL STATEMENTS — (Continued)
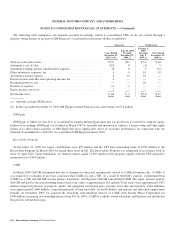
(a) Summarized financial information is not included for a joint venture that we dissolved in June 2010. We recognized equity
income of $10 million in the six months ended June 30, 2010.
(b) Summarized financial information is not included for a joint venture which remained with MLC at July 9, 2009. Old GM
recognized equity loss of $243 million in the period January 1, 2009 through July 9, 2009.
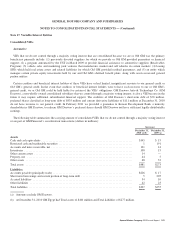
Transactions with Nonconsolidated Affiliates
Nonconsolidated affiliates are involved in various aspects of the development, production and marketing of cars, trucks and parts,
and we purchase component parts and vehicles from certain nonconsolidated affiliates for resale to dealers. The following tables
summarize the effects of transactions with nonconsolidated affiliates, excluding transactions with Ally Financial which are disclosed
in Note 32, which are not eliminated in consolidation (dollars in millions):
Successor Predecessor
Year Ended
December 31, 2010
July 10, 2009
Through
December 31, 2009
January 1, 2009
Through
July 9, 2009
Year Ended
December 31, 2008
Results of Operations
Automotive sales .................................... $2,910 $ 899 $596 $1,076
Automotive purchases, net ............................ $2,881 $1,190 $737 $3,815
Automotive selling, general and administrative expense ..... $ 3 $ (19) $ (19) $ 62
Automotive interest expense ........................... $ 16 $ — $ — $ —
Interest income and other non-operating income (expense),
net ............................................. $ 43 $ 14 $ (9) $ 231
Successor
December 31, 2010 December 31, 2009
Financial Position
Accounts and notes receivable, net .................................................. $1,618 $771
Accounts payable (principally trade) ................................................ $ 641 $579
Successor Predecessor
Year Ended
December 31, 2010
July 10, 2009
Through
December 31, 2009
January 1, 2009
Through
July 9, 2009
Year Ended
December 31, 2008
Cash Flows
Operating .......................................... $719 $538 $546 $(1,014)
Investing .......................................... $(74) $ (67) $ — $ 370
Financing .......................................... $ — $ — $ — $ —
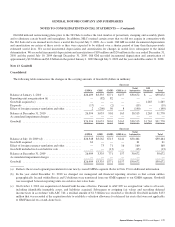
Investment in Ally Financial
As part of the approval process for Ally Financial to obtain Bank Holding Company status in December 2008, Old GM agreed to
reduce its ownership in Ally Financial to less than 10% of the voting and total equity of Ally Financial by December 24, 2011. At
December 31, 2010 our equity ownership in Ally Financial was 9.9%.
In January 2009 Old GM entered into the UST Ally Financial Loan Agreement pursuant to which Old GM borrowed $884 million
(UST Ally Financial Loan) and utilized those funds to purchase 190,921 Class B Common Membership Interests in Ally Financial.
The UST Ally Financial Loan was scheduled to mature in January 2012 and bore interest, payable quarterly, at the same rate of
interest as the UST Loans. The UST Ally Financial Loan Agreement was secured by Old GM’s Common and Preferred Membership
Interests in Ally Financial. The UST had the option to convert outstanding amounts into a maximum of 190,921 shares of Ally
Financial’s Class B Common Membership Interests on a pro rata basis.
General Motors Company 2010 Annual Report 173