General Motors 2010 Annual Report Download - page 60
Download and view the complete annual report
Please find page 60 of the 2010 General Motors annual report below. You can navigate through the pages in the report by either clicking on the pages listed below, or by using the keyword search tool below to find specific information within the annual report.-
 1
1 -
2
-
3
-
4
-
5
-
6
-
7
-
8
-
9
-
10
-
11
-
12
-
13
-
14
-
15
-
16
-
17
-
18
-
19
-
20
-
21
-
22
-
23
-
24
-
25
-
26
-
27
-
28
-
29
-
30
-
31
-
32
-
33
-
34
-
35
-
36
-
37
-
38
-
39
-
40
-
41
-
42
-
43
-
44
-
45
-
46
-
47
-
48
-
49
-
 50
50 -
 51
51 -
 52
52 -
 53
53 -
 54
54 -
 55
55 -
 56
56 -
 57
57 -
 58
58 -
 59
59 -
 60
60 -
 61
61 -
 62
62 -
 63
63 -
 64
64 -
 65
65 -
 66
66 -
 67
67 -
 68
68 -
 69
69 -
 70
70 -
71
-
72
-
73
-
74
-
75
-
76
-
77
-
78
-
79
-
80
-
81
-
82
-
83
-
84
-
85
-
86
-
87
-
88
-
89
-
90
-
91
-
92
-
93
-
94
-
95
-
96
-
97
-
98
-
99
-
100
-
101
-
102
-
103
-
104
-
105
-
106
-
107
-
108
-
109
-
110
-
111
-
112
-
113
-
114
-
115
-
116
-
117
-
118
-
119
-
120
-
121
-
122
-
123
-
124
-
125
-
126
-
127
-
128
-
129
-
130
-
131
-
132
-
133
-
134
-
135
-
136
-
137
-
138
-
139
-
140
-
141
-
142
-
143
-
144
-
145
-
146
-
147
-
148
-
149
-
150
-
151
-
152
-
153
-
154
-
155
-
156
-
157
-
158
-
159
-
160
-
161
-
162
-
163
-
164
-
165
-
166
-
167
-
168
-
169
-
170
-
171
-
172
-
173
-
174
-
175
-
176
-
177
-
178
-
179
-
180
-
181
-
182
-
183
-
184
-
185
-
186
-
187
-
188
-
189
-
190
-
191
-
192
-
193
-
194
-
195
-
196
-
197
-
198
-
199
-
200
-
201
-
202
-
203
-
204
-
205
-
206
-
207
-
208
-
209
-
210
-
211
-
212
-
213
-
214
-
215
-
216
-
217
-
218
-
219
-
220
-
221
-
222
-
223
-
224
-
225
-
226
-
227
-
228
-
229
-
230
-
231
-
232
-
233
-
234
-
235
-
236
-
237
-
238
-
239
-
240
-
241
-
242
-
243
-
244
-
245
-
246
-
247
-
248
-
249
-
250
-
251
-
252
-
253
-
254
-
255
-
256
-
257
-
258
-
259
-
260
-
261
-
262
-
263
-
264
-
265
-
266
-
267
-
268
-
269
-
270
-
271
-
272
-
273
-
274
-
275
-
276
-
277
-
278
-
279
-
280
-
281
-
282
-
283
-
284
-
285
-
286
-
287
-
288
-
289
-
290
 |
 |

GENERAL MOTORS COMPANY AND SUBSIDIARIES
Automotive Financing
Total GM Financial Assets
At December 31, 2010 Total GM Financial Assets of $10.9 billion was primarily composed of net automotive finance receivables
of $8.2 billion, Goodwill of $1.3 billion related to the acquisition of AmeriCredit, including amounts recorded to reflect the changes in
the valuation allowance on deferred tax assets that were not applicable to GM Financial on a stand-alone basis and restricted cash of
$1.1 billion associated with GM Financial’s credit facilities and securitization notes payable.
Total GM Financial Liabilities
At December 31, 2010 Total GM Financial Liabilities of $7.4 billion was primarily composed of securitization notes payable of
$6.1 billion issued in the asset backed securities market and advances on credit facilities of $0.8 billion.
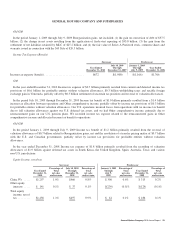
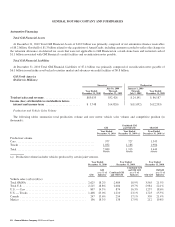
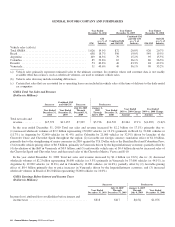
GM North America
(Dollars in Millions)
Successor Predecessor
Year Ended
December 31, 2010
July 10, 2009
Through
December 31, 2009
January 1, 2009
Through
July 9, 2009
Year Ended
December 31, 2008
Total net sales and revenue ......................... $83,035 $32,426 $ 24,191 $ 86,187
Income (loss) attributable to stockholders before
interest and income taxes ........................ $ 5,748 $ (4,820) $(11,092) $(12,203)
Production and Vehicle Sales Volume
The following tables summarize total production volume and new motor vehicle sales volume and competitive position (in
thousands):
GM
Combined GM
and Old GM Old GM
Year Ended
December 31, 2010
Year Ended
December 31, 2009 (a)
Year Ended
December 31, 2008 (a)
Production volume
Cars ....................................................... 977 727 1,543
Trucks ..................................................... 1,832 1,186 1,906
Total ...................................................... 2,809 1,913 3,449
(a) Production volume includes vehicles produced by certain joint ventures.
Year Ended
December 31, 2010
Year Ended
December 31, 2009
Year Ended
December 31, 2008
GM
GM
asa%of
Industry
Combined GM
and Old GM
Combined GM
and Old GM
asa%of
Industry Old GM
Old GM
asa%of
Industry
Vehicle sales (a)(b)(c)(d)(e)
Total GMNA ......................................... 2,625 18.2% 2,484 18.9% 3,565 21.5%
Total U.S. ............................................ 2,215 18.8% 2,084 19.7% 2,981 22.1%
U.S. — Cars .......................................... 807 14.3% 874 16.3% 1,257 18.6%
U.S. — Trucks ........................................ 1,408 23.0% 1,210 23.1% 1,723 25.5%
Canada .............................................. 247 15.6% 254 17.1% 359 21.4%
Mexico .............................................. 156 18.3% 138 17.9% 212 19.8%
58 General Motors Company 2010 Annual Report