General Motors 2010 Annual Report Download - page 266
Download and view the complete annual report
Please find page 266 of the 2010 General Motors annual report below. You can navigate through the pages in the report by either clicking on the pages listed below, or by using the keyword search tool below to find specific information within the annual report.-
 1
1 -
2
-
3
-
4
-
5
-
6
-
7
-
8
-
9
-
10
-
11
-
12
-
13
-
14
-
15
-
16
-
17
-
18
-
19
-
20
-
21
-
22
-
23
-
24
-
25
-
26
-
27
-
28
-
29
-
30
-
31
-
32
-
33
-
34
-
35
-
36
-
37
-
38
-
39
-
40
-
41
-
42
-
43
-
44
-
45
-
46
-
47
-
48
-
49
-
50
-
51
-
52
-
53
-
54
-
55
-
56
-
57
-
58
-
59
-
60
-
61
-
62
-
63
-
64
-
65
-
66
-
67
-
68
-
69
-
70
-
71
-
72
-
73
-
74
-
75
-
76
-
77
-
78
-
79
-
80
-
81
-
82
-
83
-
84
-
85
-
86
-
87
-
88
-
89
-
90
-
91
-
92
-
93
-
94
-
95
-
96
-
97
-
98
-
99
-
100
-
101
-
102
-
103
-
104
-
105
-
106
-
107
-
108
-
109
-
110
-
111
-
112
-
113
-
114
-
115
-
116
-
117
-
118
-
119
-
120
-
121
-
122
-
123
-
124
-
125
-
126
-
127
-
128
-
129
-
130
-
131
-
132
-
133
-
134
-
135
-
136
-
137
-
138
-
139
-
140
-
141
-
142
-
143
-
144
-
145
-
146
-
147
-
148
-
149
-
150
-
151
-
152
-
153
-
154
-
155
-
156
-
157
-
158
-
159
-
160
-
161
-
162
-
163
-
164
-
165
-
166
-
167
-
168
-
169
-
170
-
171
-
172
-
173
-
174
-
175
-
176
-
177
-
178
-
179
-
180
-
181
-
182
-
183
-
184
-
185
-
186
-
187
-
188
-
189
-
190
-
191
-
192
-
193
-
194
-
195
-
196
-
197
-
198
-
199
-
200
-
201
-
202
-
203
-
204
-
205
-
206
-
207
-
208
-
209
-
210
-
211
-
212
-
213
-
214
-
215
-
216
-
217
-
218
-
219
-
220
-
221
-
222
-
223
-
224
-
225
-
226
-
227
-
228
-
229
-
230
-
231
-
232
-
233
-
234
-
235
-
236
-
237
-
238
-
239
-
240
-
241
-
242
-
243
-
244
-
245
-
246
-
247
-
248
-
249
-
250
-
251
-
252
-
253
-
254
-
255
-
 256
256 -
 257
257 -
 258
258 -
 259
259 -
 260
260 -
 261
261 -
 262
262 -
 263
263 -
 264
264 -
 265
265 -
 266
266 -
 267
267 -
 268
268 -
 269
269 -
 270
270 -
 271
271 -
 272
272 -
 273
273 -
 274
274 -
 275
275 -
 276
276 -
277
-
278
-
279
-
280
-
281
-
282
-
283
-
284
-
285
-
286
-
287
-
288
-
289
-
290
 |
 |

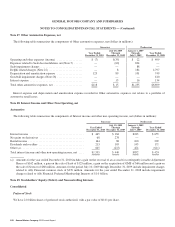
GENERAL MOTORS COMPANY AND SUBSIDIARIES
NOTES TO CONSOLIDATED FINANCIAL STATEMENTS — (Continued)
Successor Predecessor
Year Ended
December 31,
2010 (a)
July 10, 2009
Through
December 31,
2009 (b)
January 1, 2009
Through
July 9, 2009
Year Ended
December 31,
2008
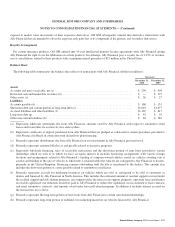
Basic
Net income (loss) attributable to common
stockholders — basic ......................................... $4,668 $(4,428) $109,118 $(30,943)
Addition of preferred dividends to holders of Series B Preferred Stock . . 25 — — —
Net income (loss) attributable to common stockholders-diluted ........ $4,693 $(4,428) $109,118 $(30,943)
Basic and Diluted shares
Weighted-average common shares outstanding-basic ................ 1,500 1,238 611 579
Dilutive effect of warrants ..................................... 106 — — —
Dilutive effect of conversion of Series B Preferred Stock ............. 17 — — —
Dilutive effect of RSUs ........................................ 1 — — —
Weighted-average common shares outstanding-diluted ............... 1,624 1,238 611 579
Basic earnings per share ....................................... $ 3.11 $ (3.58) $ 178.63 $ (53.47)
Diluted earnings per share ...................................... $ 2.89 $ (3.58) $ 178.55 $ (53.47)
(a) The year ended December 31, 2010 includes earned but undeclared dividends of $26 million on our Series A Preferred Stock and
$25 million on our Series B Preferred Stock, which decreases Net income attributable to common stockholders.
(b) The period July 10, 2009 through December 31, 2009 includes accumulated but undeclared dividends of $34 million on Series A
Preferred Stock, which increases Net loss attributable to common stockholders, and excludes dividends of $252 million on
Series A Preferred Stock, which were paid to the New VEBA prior to December 31, 2009. The 260 million shares of Series A
Preferred Stock issued to the New VEBA were not considered outstanding until December 31, 2009 due to the terms of the 2009
UAW Retiree Settlement Agreement.
GM
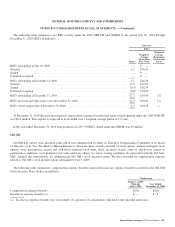
In the year ended December 31, 2010 we considered potentially dilutive securities in our diluted earnings per share computation
under the treasury stock method. In periods prior to our public offering, we utilized an average stock price based upon estimates of the
fair value of our common stock. Subsequent to our public offering, we used the New York Stock Exchange price.
In the year ended December 31, 2010 because the market value of our common stock was within the price range of $33.00 to
$39.60 per common share no undistributed earnings were allocated to our Series B Preferred Stock under the two-class method for
purposes of calculating basic earnings per share. The dilutive effect of these securities was determined by assuming conversion of the
securities at issuance resulting in an increase to the weighted-average common shares outstanding and an increase to Net income
attributable to common stockholders for accumulated dividends on our Series B Preferred Stock.
In the year ended December 31, 2010 warrants to purchase 318 million shares were outstanding, of which 46 million were not
included in the computation of diluted earnings per share because the warrants’ exercise price was greater than the average market
price of the common shares. Under the treasury stock method, the assumed exercise of the remaining 272 million warrants resulted in
106 million dilutive shares for the year ended December 31, 2010.
In the year ended December 31, 2010 diluted earnings per share included the assumed issuance of unvested restricted stock units
(RSUs) granted to certain global executives. The dilutive effect of the RSUs was included only for the period subsequent to our public
offering as the RSUs prior were accounted for as liability awards prior to that date. At December 31, 2010 there were 11 million
unvested RSUs outstanding.
264 General Motors Company 2010 Annual Report