General Motors 2010 Annual Report Download - page 269
Download and view the complete annual report
Please find page 269 of the 2010 General Motors annual report below. You can navigate through the pages in the report by either clicking on the pages listed below, or by using the keyword search tool below to find specific information within the annual report.-
 1
1 -
2
-
3
-
4
-
5
-
6
-
7
-
8
-
9
-
10
-
11
-
12
-
13
-
14
-
15
-
16
-
17
-
18
-
19
-
20
-
21
-
22
-
23
-
24
-
25
-
26
-
27
-
28
-
29
-
30
-
31
-
32
-
33
-
34
-
35
-
36
-
37
-
38
-
39
-
40
-
41
-
42
-
43
-
44
-
45
-
46
-
47
-
48
-
49
-
50
-
51
-
52
-
53
-
54
-
55
-
56
-
57
-
58
-
59
-
60
-
61
-
62
-
63
-
64
-
65
-
66
-
67
-
68
-
69
-
70
-
71
-
72
-
73
-
74
-
75
-
76
-
77
-
78
-
79
-
80
-
81
-
82
-
83
-
84
-
85
-
86
-
87
-
88
-
89
-
90
-
91
-
92
-
93
-
94
-
95
-
96
-
97
-
98
-
99
-
100
-
101
-
102
-
103
-
104
-
105
-
106
-
107
-
108
-
109
-
110
-
111
-
112
-
113
-
114
-
115
-
116
-
117
-
118
-
119
-
120
-
121
-
122
-
123
-
124
-
125
-
126
-
127
-
128
-
129
-
130
-
131
-
132
-
133
-
134
-
135
-
136
-
137
-
138
-
139
-
140
-
141
-
142
-
143
-
144
-
145
-
146
-
147
-
148
-
149
-
150
-
151
-
152
-
153
-
154
-
155
-
156
-
157
-
158
-
159
-
160
-
161
-
162
-
163
-
164
-
165
-
166
-
167
-
168
-
169
-
170
-
171
-
172
-
173
-
174
-
175
-
176
-
177
-
178
-
179
-
180
-
181
-
182
-
183
-
184
-
185
-
186
-
187
-
188
-
189
-
190
-
191
-
192
-
193
-
194
-
195
-
196
-
197
-
198
-
199
-
200
-
201
-
202
-
203
-
204
-
205
-
206
-
207
-
208
-
209
-
210
-
211
-
212
-
213
-
214
-
215
-
216
-
217
-
218
-
219
-
220
-
221
-
222
-
223
-
224
-
225
-
226
-
227
-
228
-
229
-
230
-
231
-
232
-
233
-
234
-
235
-
236
-
237
-
238
-
239
-
240
-
241
-
242
-
243
-
244
-
245
-
246
-
247
-
248
-
249
-
250
-
251
-
252
-
253
-
254
-
255
-
256
-
257
-
258
-
 259
259 -
 260
260 -
 261
261 -
 262
262 -
 263
263 -
 264
264 -
 265
265 -
 266
266 -
 267
267 -
 268
268 -
 269
269 -
 270
270 -
 271
271 -
 272
272 -
 273
273 -
 274
274 -
 275
275 -
 276
276 -
 277
277 -
 278
278 -
 279
279 -
280
-
281
-
282
-
283
-
284
-
285
-
286
-
287
-
288
-
289
-
290
 |
 |

GENERAL MOTORS COMPANY AND SUBSIDIARIES
NOTES TO CONSOLIDATED FINANCIAL STATEMENTS — (Continued)
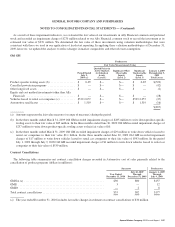
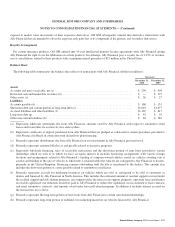
The following table summarizes our RSU activity under the 2009 GMLTIP and GMSSP in the period July 10, 2009 through
December 31, 2010 (RSUs in millions):
Successor
RSUs
Shares
Weighted-
Average
Grant Date
Fair Value
Weighted-
Average
Remaining
Contractual
Term
RSUs outstanding at July 10, 2009 ..................................................... — $ —
Granted .......................................................................... 1.1 $16.39
Settled ........................................................................... — $ —
Forfeited or expired ................................................................ — $ —
RSUs outstanding at December 31, 2009 ................................................ 1.1 $16.39
Granted .......................................................................... 17.2 $19.17
Settled ........................................................................... (0.3) $16.39
Forfeited or expired ................................................................ (0.8) $18.80
RSUs outstanding at December 31, 2010 ................................................ 17.2 $19.03 1.8
RSUs unvested and expected to vest at December 31, 2010 ................................. 11.9 $18.82 2.2
RSUs vested and payable at December 31, 2010 .......................................... 4.7 $19.58 —
At December 31, 2010 the total unrecognized compensation expense for nonvested equity awards granted under the 2009 GMLTIP
was $313 million. This expense is expected to be recorded over a weighted-average period of 2.2 years.
In the year ended December 31, 2010 total payments for 291,753 RSUs settled under the GMSSP was $5 million.
Old GM
Old GM had various stock incentive plans which were administered by either its Executive Compensation Committee of its Board
of Directors or its Vice President of Human Resources. Stock incentive awards consisted of stock options, market-contingent stock
options, stock performance awards and cash-based restricted stock units. Stock incentive awards, some of which were subject to
performance conditions, were granted at fair value and were subject to various vesting conditions. In connection with the 363 Sale,
MLC retained the responsibility for administering Old GM’s stock incentive plans. We have recorded no compensation expense
related to Old GM’s stock incentive plans subsequent to July 9, 2009.
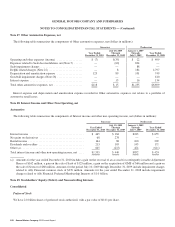
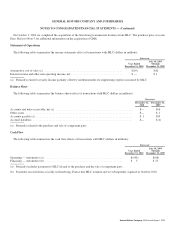
The following table summarizes compensation expense (benefit) and total Income tax expense (benefit) recorded for the Old GM
Stock Incentive Plans (dollars in millions):
Predecessor
January 1, 2009
Through
July 9, 2009
Year Ended
December 31, 2008
Compensation expense (benefit) ...................................................... $(10) $(65)
Income tax expense (benefit) (a) ...................................................... $— $ 3
(a) Income tax expense (benefit) does not include U.S. and non-U.S. jurisdictions which have full valuation allowances.
General Motors Company 2010 Annual Report 267