General Motors 2010 Annual Report Download - page 71
Download and view the complete annual report
Please find page 71 of the 2010 General Motors annual report below. You can navigate through the pages in the report by either clicking on the pages listed below, or by using the keyword search tool below to find specific information within the annual report.-
 1
1 -
2
-
3
-
4
-
5
-
6
-
7
-
8
-
9
-
10
-
11
-
12
-
13
-
14
-
15
-
16
-
17
-
18
-
19
-
20
-
21
-
22
-
23
-
24
-
25
-
26
-
27
-
28
-
29
-
30
-
31
-
32
-
33
-
34
-
35
-
36
-
37
-
38
-
39
-
40
-
41
-
42
-
43
-
44
-
45
-
46
-
47
-
48
-
49
-
50
-
51
-
52
-
53
-
54
-
55
-
56
-
57
-
58
-
59
-
60
-
 61
61 -
 62
62 -
 63
63 -
 64
64 -
 65
65 -
 66
66 -
 67
67 -
 68
68 -
 69
69 -
 70
70 -
 71
71 -
 72
72 -
 73
73 -
 74
74 -
 75
75 -
 76
76 -
 77
77 -
 78
78 -
 79
79 -
 80
80 -
 81
81 -
82
-
83
-
84
-
85
-
86
-
87
-
88
-
89
-
90
-
91
-
92
-
93
-
94
-
95
-
96
-
97
-
98
-
99
-
100
-
101
-
102
-
103
-
104
-
105
-
106
-
107
-
108
-
109
-
110
-
111
-
112
-
113
-
114
-
115
-
116
-
117
-
118
-
119
-
120
-
121
-
122
-
123
-
124
-
125
-
126
-
127
-
128
-
129
-
130
-
131
-
132
-
133
-
134
-
135
-
136
-
137
-
138
-
139
-
140
-
141
-
142
-
143
-
144
-
145
-
146
-
147
-
148
-
149
-
150
-
151
-
152
-
153
-
154
-
155
-
156
-
157
-
158
-
159
-
160
-
161
-
162
-
163
-
164
-
165
-
166
-
167
-
168
-
169
-
170
-
171
-
172
-
173
-
174
-
175
-
176
-
177
-
178
-
179
-
180
-
181
-
182
-
183
-
184
-
185
-
186
-
187
-
188
-
189
-
190
-
191
-
192
-
193
-
194
-
195
-
196
-
197
-
198
-
199
-
200
-
201
-
202
-
203
-
204
-
205
-
206
-
207
-
208
-
209
-
210
-
211
-
212
-
213
-
214
-
215
-
216
-
217
-
218
-
219
-
220
-
221
-
222
-
223
-
224
-
225
-
226
-
227
-
228
-
229
-
230
-
231
-
232
-
233
-
234
-
235
-
236
-
237
-
238
-
239
-
240
-
241
-
242
-
243
-
244
-
245
-
246
-
247
-
248
-
249
-
250
-
251
-
252
-
253
-
254
-
255
-
256
-
257
-
258
-
259
-
260
-
261
-
262
-
263
-
264
-
265
-
266
-
267
-
268
-
269
-
270
-
271
-
272
-
273
-
274
-
275
-
276
-
277
-
278
-
279
-
280
-
281
-
282
-
283
-
284
-
285
-
286
-
287
-
288
-
289
-
290
 |
 |

GENERAL MOTORS COMPANY AND SUBSIDIARIES
GM
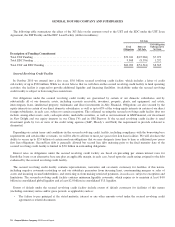
In the year ended December 31, 2010 EBIT was $0.8 billion and included: (1) foreign currency transaction gains of $0.3 billion
primarily due to foreign currency exchanges done at the preferential rate in Venezuela; offset by (2) administrative expenses of $0.5
billion; (3) advertising and sales promotion expenses of $0.3 billion primarily to support media campaigns for our products; and
(4) selling and marketing expenses of $0.1 billion.
In the period July 10, 2009 through December 31, 2009 EBIT was $0.4 billion and included: (1) administrative expenses of
$0.2 billion; (2) advertising and sales promotion expenses of $0.1 billion; and (3) selling and marketing expenses of $0.1 billion.
Old GM
In the period January 1, 2009 through July 9, 2009 EBIT was a loss of $0.5 billion and included: (1) foreign currency transaction
losses of $0.5 billion primarily due to foreign currency exchanges processed outside CADIVI in Venezuela; (2) administrative
expenses of $0.2 billion; (3) advertising and sales promotion expenses of $0.1 billion; and (4) selling and marketing expenses of $0.1
billion.
In the year ended December 31, 2008 EBIT was $1.1 billion and included: (1) administrative expenses of $0.4 billion; (2) foreign
currency transaction losses of $0.3 billion primarily due to foreign currency exchanges processed outside CADIVI in Venezuela;
(3) advertising and sales promotion expenses of $0.2 billion; and (4) selling and marketing expenses of $0.1 billion.
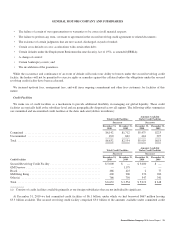
GM Financial
(Dollars in Millions)
Three Months Ended December 31, 2010
Successor
Three Months
Ended
December 31, 2010
Total revenue ................................................................................. $281
Income before income taxes ..................................................................... $129
In the three months ended December 31, 2010 Total revenue included finance charge income of $264 million and other income of
$17 million. The effective yield on GM Financial’s finance receivables was 12.1% for the three months ended December 31, 2010.
The effective yield represents finance charges and fees recorded in earnings and the accretion of the purchase accounting premium
during the period as a percentage of average finance receivable.
Net margin is the difference between finance charge income and other income earned on GM Financial’s finance receivables and
the cost to fund the receivables as well as the cost of debt incurred for general corporate purposes.
The following table summarizes GM Financial’s net margin and as a percentage of average finance receivables (dollars in
millions):
Successor
Three Months
Ended
December 31, 2010
Finance charge income ........................................................................... $264 12.1%
Other income ................................................................................... 17 0.8%
Interest expense ................................................................................. (37) (1.7)%
Net GM Financial margin ......................................................................... $244 11.2%
General Motors Company 2010 Annual Report 69