General Motors 2010 Annual Report Download - page 102
Download and view the complete annual report
Please find page 102 of the 2010 General Motors annual report below. You can navigate through the pages in the report by either clicking on the pages listed below, or by using the keyword search tool below to find specific information within the annual report.-
 1
1 -
2
-
3
-
4
-
5
-
6
-
7
-
8
-
9
-
10
-
11
-
12
-
13
-
14
-
15
-
16
-
17
-
18
-
19
-
20
-
21
-
22
-
23
-
24
-
25
-
26
-
27
-
28
-
29
-
30
-
31
-
32
-
33
-
34
-
35
-
36
-
37
-
38
-
39
-
40
-
41
-
42
-
43
-
44
-
45
-
46
-
47
-
48
-
49
-
50
-
51
-
52
-
53
-
54
-
55
-
56
-
57
-
58
-
59
-
60
-
61
-
62
-
63
-
64
-
65
-
66
-
67
-
68
-
69
-
70
-
71
-
72
-
73
-
74
-
75
-
76
-
77
-
78
-
79
-
80
-
81
-
82
-
83
-
84
-
85
-
86
-
87
-
88
-
89
-
90
-
91
-
 92
92 -
 93
93 -
 94
94 -
 95
95 -
 96
96 -
 97
97 -
 98
98 -
 99
99 -
 100
100 -
 101
101 -
 102
102 -
 103
103 -
 104
104 -
 105
105 -
 106
106 -
 107
107 -
 108
108 -
 109
109 -
 110
110 -
 111
111 -
 112
112 -
113
-
114
-
115
-
116
-
117
-
118
-
119
-
120
-
121
-
122
-
123
-
124
-
125
-
126
-
127
-
128
-
129
-
130
-
131
-
132
-
133
-
134
-
135
-
136
-
137
-
138
-
139
-
140
-
141
-
142
-
143
-
144
-
145
-
146
-
147
-
148
-
149
-
150
-
151
-
152
-
153
-
154
-
155
-
156
-
157
-
158
-
159
-
160
-
161
-
162
-
163
-
164
-
165
-
166
-
167
-
168
-
169
-
170
-
171
-
172
-
173
-
174
-
175
-
176
-
177
-
178
-
179
-
180
-
181
-
182
-
183
-
184
-
185
-
186
-
187
-
188
-
189
-
190
-
191
-
192
-
193
-
194
-
195
-
196
-
197
-
198
-
199
-
200
-
201
-
202
-
203
-
204
-
205
-
206
-
207
-
208
-
209
-
210
-
211
-
212
-
213
-
214
-
215
-
216
-
217
-
218
-
219
-
220
-
221
-
222
-
223
-
224
-
225
-
226
-
227
-
228
-
229
-
230
-
231
-
232
-
233
-
234
-
235
-
236
-
237
-
238
-
239
-
240
-
241
-
242
-
243
-
244
-
245
-
246
-
247
-
248
-
249
-
250
-
251
-
252
-
253
-
254
-
255
-
256
-
257
-
258
-
259
-
260
-
261
-
262
-
263
-
264
-
265
-
266
-
267
-
268
-
269
-
270
-
271
-
272
-
273
-
274
-
275
-
276
-
277
-
278
-
279
-
280
-
281
-
282
-
283
-
284
-
285
-
286
-
287
-
288
-
289
-
290
 |
 |

GENERAL MOTORS COMPANY AND SUBSIDIARIES
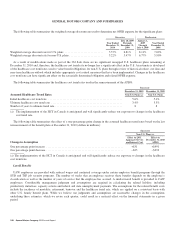
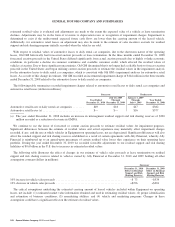
The following table summarizes the weighted-average discount rate used to determine net OPEB expense for the significant plans:
Successor Predecessor
Year Ended
December 31,
2010
July 10, 2009
Through
December 31,
2009
January 1,
2009
Through
July 9, 2009
Year Ended
December 31,
2008
Weighted-average discount rate for U.S. plans ........................... 5.57% 6.81% 8.11% 7.02%
Weighted-average discount rate for non-U.S. plans ........................ 5.22% 5.47% 6.77% 5.90%
As a result of modifications made as part of the 363 Sale, there are no significant uncapped U.S. healthcare plans remaining at
December 31, 2010 and, therefore, the healthcare cost trend rate no longer has a significant effect in the U.S. An estimate is developed
of the healthcare cost trend rates used to value benefit obligations for non-U.S. plans through review of historical retiree cost data and
near-term healthcare outlook which includes appropriate cost control measures that have been implemented. Changes in the healthcare
cost trend rate can have significant effect on the actuarially determined obligation and related OPEB expense.
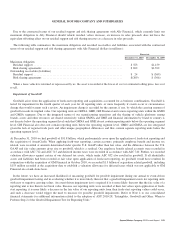
The following table summarizes the healthcare cost trend rates used in the remeasurement of the APBO:
Successor
December 31, 2010 December 31, 2009
Assumed Healthcare Trend Rates Non-U.S. Plans (a) Non-U.S. Plans
Initial healthcare cost trend rate .................................................... 5.6% 5.4%
Ultimate healthcare cost trend rate .................................................. 3.4% 3.3%
Number of years to ultimate trend rate ............................................... 8 8
(a) The implementation of the HCT in Canada is anticipated and will significantly reduce our exposure to changes in the healthcare
cost trend rate.
The following table summarizes the effect of a one-percentage point change in the assumed healthcare trend rates based on the last
remeasurement of the benefit plans at December 31, 2010 (dollars in millions):
Successor
Non-U.S. Plans (a)
Change in Assumption
Effect on 2011
Aggregate Service
and Interest Cost
Effect on
December 31, 2010
APBO
One percentage point increase ...................................................... +$31 +$491
One percentage point decrease ...................................................... –$25 –$392
(a) The implementation of the HCT in Canada is anticipated and will significantly reduce our exposure to changes in the healthcare
cost trend rate.
Layoff Benefits
UAW employees are provided with reduced wages and continued coverage under certain employee benefit programs through the
SUB and TSP job security programs. The number of weeks that an employee receives these benefits depends on the employee’s
classification as well as the number of years of service that the employee has accrued. A similar tiered benefit is provided to CAW
employees. Considerable management judgment and assumptions are required in calculating the related liability, including
productivity initiatives, capacity actions and federal and state unemployment payments. The assumptions for the related benefit costs
include the incidence of mortality, retirement, turnover and the healthcare trend rate, which are applied on a consistent basis with
other U.S. hourly benefit plans. While we believe our judgments and assumptions are reasonable, changes in the assumptions
underlying these estimates, which we revise each quarter, could result in a material effect on the financial statements in a given
period.
100 General Motors Company 2010 Annual Report