General Motors 2010 Annual Report Download - page 22
Download and view the complete annual report
Please find page 22 of the 2010 General Motors annual report below. You can navigate through the pages in the report by either clicking on the pages listed below, or by using the keyword search tool below to find specific information within the annual report.-
 1
1 -
2
-
3
-
4
-
5
-
6
-
7
-
8
-
9
-
10
-
11
-
 12
12 -
 13
13 -
 14
14 -
 15
15 -
 16
16 -
 17
17 -
 18
18 -
 19
19 -
 20
20 -
 21
21 -
 22
22 -
 23
23 -
 24
24 -
 25
25 -
 26
26 -
 27
27 -
 28
28 -
 29
29 -
 30
30 -
 31
31 -
 32
32 -
33
-
34
-
35
-
36
-
37
-
38
-
39
-
40
-
41
-
42
-
43
-
44
-
45
-
46
-
47
-
48
-
49
-
50
-
51
-
52
-
53
-
54
-
55
-
56
-
57
-
58
-
59
-
60
-
61
-
62
-
63
-
64
-
65
-
66
-
67
-
68
-
69
-
70
-
71
-
72
-
73
-
74
-
75
-
76
-
77
-
78
-
79
-
80
-
81
-
82
-
83
-
84
-
85
-
86
-
87
-
88
-
89
-
90
-
91
-
92
-
93
-
94
-
95
-
96
-
97
-
98
-
99
-
100
-
101
-
102
-
103
-
104
-
105
-
106
-
107
-
108
-
109
-
110
-
111
-
112
-
113
-
114
-
115
-
116
-
117
-
118
-
119
-
120
-
121
-
122
-
123
-
124
-
125
-
126
-
127
-
128
-
129
-
130
-
131
-
132
-
133
-
134
-
135
-
136
-
137
-
138
-
139
-
140
-
141
-
142
-
143
-
144
-
145
-
146
-
147
-
148
-
149
-
150
-
151
-
152
-
153
-
154
-
155
-
156
-
157
-
158
-
159
-
160
-
161
-
162
-
163
-
164
-
165
-
166
-
167
-
168
-
169
-
170
-
171
-
172
-
173
-
174
-
175
-
176
-
177
-
178
-
179
-
180
-
181
-
182
-
183
-
184
-
185
-
186
-
187
-
188
-
189
-
190
-
191
-
192
-
193
-
194
-
195
-
196
-
197
-
198
-
199
-
200
-
201
-
202
-
203
-
204
-
205
-
206
-
207
-
208
-
209
-
210
-
211
-
212
-
213
-
214
-
215
-
216
-
217
-
218
-
219
-
220
-
221
-
222
-
223
-
224
-
225
-
226
-
227
-
228
-
229
-
230
-
231
-
232
-
233
-
234
-
235
-
236
-
237
-
238
-
239
-
240
-
241
-
242
-
243
-
244
-
245
-
246
-
247
-
248
-
249
-
250
-
251
-
252
-
253
-
254
-
255
-
256
-
257
-
258
-
259
-
260
-
261
-
262
-
263
-
264
-
265
-
266
-
267
-
268
-
269
-
270
-
271
-
272
-
273
-
274
-
275
-
276
-
277
-
278
-
279
-
280
-
281
-
282
-
283
-
284
-
285
-
286
-
287
-
288
-
289
-
290
 |
 |

20 General Motors Company 2010 Annual Report
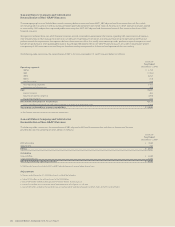
General Motors Company and Subsidiaries
Reconciliation of Non-GAAP Measures
The accompanying Letter to Stakeholders includes earnings before interest and taxes (EBIT), EBIT adjusted and Automotive free cash flow which
are not prepared in accordance with accounting principles generally accepted in the United States of America (U.S. GAAP) and have not been audited
or reviewed by GM’s independent registered public accounting firm. EBIT, EBIT adjusted and Automotive free cash flow are considered non-GAAP
financial measures.
Management believes these non-GAAP financial measures provide meaningful supplemental information regarding GM’s operating results because
they exclude amounts that management does not consider part of operating results when assessing and measuring the operational and financial
performance of the organization. Management believes these measures allow it to readily view operating trends, perform analytical comparisons and
benchmark performance among geographic regions. Accordingly, GM believes these non-GAAP financial measures are useful in allowing for greater
transparency of GM’s core operations and they are therefore used by management in its financial and operational decision-making.
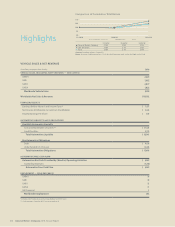
The following table summarizes the reconciliation of EBIT to its most comparable U.S. GAAP measure (dollars in millions):
Operating segments
GMNA $ 5,748
GME (1,764
GMIO 2,262
GMSA 818
GM Financial(a) 129
Total operating segments 7,193
Corporate and eliminations 284
EBIT 7,477
Interest income 465
Automotive interest expense 1,098
Income tax expense 672
Net income attributable to stockholders 6,172
Less: Cumulative dividends on and charge related to purchase of preferred stock 1,504
Net income attributable to common stockholders $ 4,668
(a) GM Financial amounts represent income before income taxes.
General Motors Company and Subsidiaries
Reconciliation of Non-GAAP Measures
The following table summarizes the reconciliation of EBIT adjusted to EBIT and Automotive free cash flow to Automotive Net cash
provided by (used in) operating activities (dollars in millions):
EBIT adjusted(a) $ 7,030
Adjustments 447
EBIT(a) $ 7,477
Automotive
Free cash flow $ 2,389
Capital expenditures 4,200
Net cash provided by operating activities $ 6,589
(a) GM Financial amounts included in EBIT and EBIT adjusted represent income before income taxes.
Adjustments
In the year ended December 31, 2010 Adjustments included the following:
l Gain of $198 million on the extinguishment of the VEBA Notes;
l Gain of $66 million related to the acquisition of General Motors Strasbourg S.A.S;
l Gain of $123 million as a result of the sale of Saab Automobile AB to Spyker Cars NV; and
l Gain of $60 million related to the sale of Nexteer, a manufacturer of steering components and half-shafts, to Pacific Century Motors
Successor
Year Ended
December 31, 2010
Successor
Year Ended
December 31, 2010
)