General Motors 2010 Annual Report Download - page 115
Download and view the complete annual report
Please find page 115 of the 2010 General Motors annual report below. You can navigate through the pages in the report by either clicking on the pages listed below, or by using the keyword search tool below to find specific information within the annual report.-
 1
1 -
2
-
3
-
4
-
5
-
6
-
7
-
8
-
9
-
10
-
11
-
12
-
13
-
14
-
15
-
16
-
17
-
18
-
19
-
20
-
21
-
22
-
23
-
24
-
25
-
26
-
27
-
28
-
29
-
30
-
31
-
32
-
33
-
34
-
35
-
36
-
37
-
38
-
39
-
40
-
41
-
42
-
43
-
44
-
45
-
46
-
47
-
48
-
49
-
50
-
51
-
52
-
53
-
54
-
55
-
56
-
57
-
58
-
59
-
60
-
61
-
62
-
63
-
64
-
65
-
66
-
67
-
68
-
69
-
70
-
71
-
72
-
73
-
74
-
75
-
76
-
77
-
78
-
79
-
80
-
81
-
82
-
83
-
84
-
85
-
86
-
87
-
88
-
89
-
90
-
91
-
92
-
93
-
94
-
95
-
96
-
97
-
98
-
99
-
100
-
101
-
102
-
103
-
104
-
 105
105 -
 106
106 -
 107
107 -
 108
108 -
 109
109 -
 110
110 -
 111
111 -
 112
112 -
 113
113 -
 114
114 -
 115
115 -
 116
116 -
 117
117 -
 118
118 -
 119
119 -
 120
120 -
 121
121 -
 122
122 -
 123
123 -
 124
124 -
 125
125 -
126
-
127
-
128
-
129
-
130
-
131
-
132
-
133
-
134
-
135
-
136
-
137
-
138
-
139
-
140
-
141
-
142
-
143
-
144
-
145
-
146
-
147
-
148
-
149
-
150
-
151
-
152
-
153
-
154
-
155
-
156
-
157
-
158
-
159
-
160
-
161
-
162
-
163
-
164
-
165
-
166
-
167
-
168
-
169
-
170
-
171
-
172
-
173
-
174
-
175
-
176
-
177
-
178
-
179
-
180
-
181
-
182
-
183
-
184
-
185
-
186
-
187
-
188
-
189
-
190
-
191
-
192
-
193
-
194
-
195
-
196
-
197
-
198
-
199
-
200
-
201
-
202
-
203
-
204
-
205
-
206
-
207
-
208
-
209
-
210
-
211
-
212
-
213
-
214
-
215
-
216
-
217
-
218
-
219
-
220
-
221
-
222
-
223
-
224
-
225
-
226
-
227
-
228
-
229
-
230
-
231
-
232
-
233
-
234
-
235
-
236
-
237
-
238
-
239
-
240
-
241
-
242
-
243
-
244
-
245
-
246
-
247
-
248
-
249
-
250
-
251
-
252
-
253
-
254
-
255
-
256
-
257
-
258
-
259
-
260
-
261
-
262
-
263
-
264
-
265
-
266
-
267
-
268
-
269
-
270
-
271
-
272
-
273
-
274
-
275
-
276
-
277
-
278
-
279
-
280
-
281
-
282
-
283
-
284
-
285
-
286
-
287
-
288
-
289
-
290
 |
 |

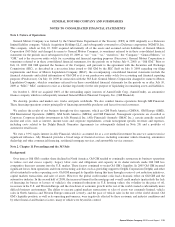
GENERAL MOTORS COMPANY AND SUBSIDIARIES
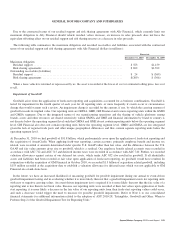
securitization transactions are included in Total GM Financial Assets and the fair value of the interest rate cap derivatives sold are
included in Total GM Financial Liabilities. Changes in the fair value of the interest rate cap derivatives are a component of interest
expense recorded in GM Financial operating expenses and other.
GM Financial has entered into interest rate swap derivatives to hedge the variability in interest payments on eight of its active
securitization transactions. Portions of these interest rate swap derivatives are designated and qualify as cash flow hedges. The fair
value of interest rate swap derivatives designated as hedges is included in GM Financial Other liabilities. Interest rate swap
derivatives that are not designated as hedges are included in GM Financial Other assets.
The following table summarizes GM Financial’s interest rate sensitive assets and liabilities by year of expected maturity and the
fair value of those assets and liabilities at December 31, 2010 (dollars in millions):
Years Ending December 31,
December 31,
2010
2011 2012 2013 2014 2015 Thereafter
Fair
Value
Assets
Finance receivables
Principal amounts ............................... $3,755 $2,434 $1,287 $ 678 $ 372 $ 161 $8,186
Weighted-average annual percentage rate ............ 15.74% 15.66% 15.57% 15.36% 15.21% 15.37%
Interest rate swap agreements
Notional amounts ............................... $ 754 $ 460 $ 13 $ — $ — $ — $ 23
Average pay rate ................................ 5.32% 3.53% 0.97% — — —
Average receive rate ............................. 1.03% 1.16% 0.43% — — —
Interest rate cap agreements
Notional amounts ............................... $ 177 $ 164 $ 144 $ 169 $ 79 $ 213 $ 8
Average strike rate .............................. 4.81% 4.73% 4.71% 4.53% 4.18% 3.47%
Liabilities
Credit facilities
Principal amounts ............................... $ 533 $ 296 $ — $ — $ — $ — $ 832
Weighted-average interest rate ..................... 3.19% 2.28% — — — —
Securitization notes
Principal amounts ............................... $2,961 $1,703 $ 659 $ 423 $ 275 $ — $6,107
Weighted-average interest rate ..................... 3.44% 4.03% 4.44% 4.38% 4.88% —
Senior notes
Principal amounts ............................... $ — $ — $ — $ — $ 68 $ — $ 71
Weighted-average interest rate .....................————8.50% —
Convertible senior notes
Principal amounts ............................... $ 1 $ — $ 1 $ — $ — $ — $ 1
Weighted-average coupon interest rate .............. 0.75% — 2.13% — — —
Interest rate swap agreements
Notional amounts ............................... $ 754 $ 460 $ 13 $ — $ — $ — $ 47
Average pay rate ................................ 5.32% 3.53% 0.97% — — —
Average receive rate ............................. 1.03% 1.16% 0.43% — — —
Interest rate cap agreements
Notional amounts ............................... $ 104 $ 123 $ 144 $ 169 $ 79 $ 213 $ 8
Average strike rate .............................. 4.94% 4.85% 4.71% 4.53% 4.18% 3.47%
General Motors Company 2010 Annual Report 113